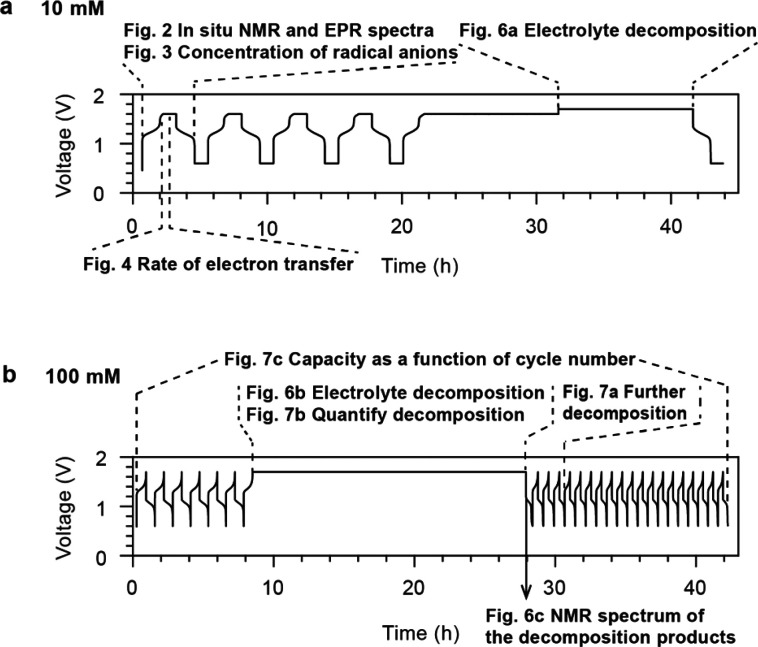
Figure 1.
Cycling regimes used to analyze the various phenomena occurring in the DHAQ flow battery. The regions of interest are highlighted by dotted lines or solid arrows, and the voltage profiles are labeled with the subsequent figures that provide a more detailed analysis of the various processes. (a) Voltage of a 10 mM DHAQ versus 15 mM K4[Fe(CN)6] and 3.75 mM K3[Fe(CN)6] full cell as a function of time. During charge, a constant current of 10 mA was applied, followed by a voltage hold at 1.6 V. During discharge, a constant current of −10 mA (where the sign indicates the polarity of the electrodes) was applied, followed by a potential hold at 0.6 V. The charge–discharge cycles were repeated four times, then potential holds of 10 h each were applied at 1.6 and 1.7 V. (b) Voltage of a 100 mM DHAQ versus 150 mM K4[Fe(CN)6] and 50 mM K3[Fe(CN)6] full cell. During charge, a constant current of 150 mA was applied to a cutoff voltage of 1.7 V. During discharge, a constant current of −150 mA was applied to a cutoff voltage of 0.6 V. The 7th charge was followed by a voltage hold at 1.7 V for 20 h and another 20 charge/discharge cycles.

