
Figure 5.
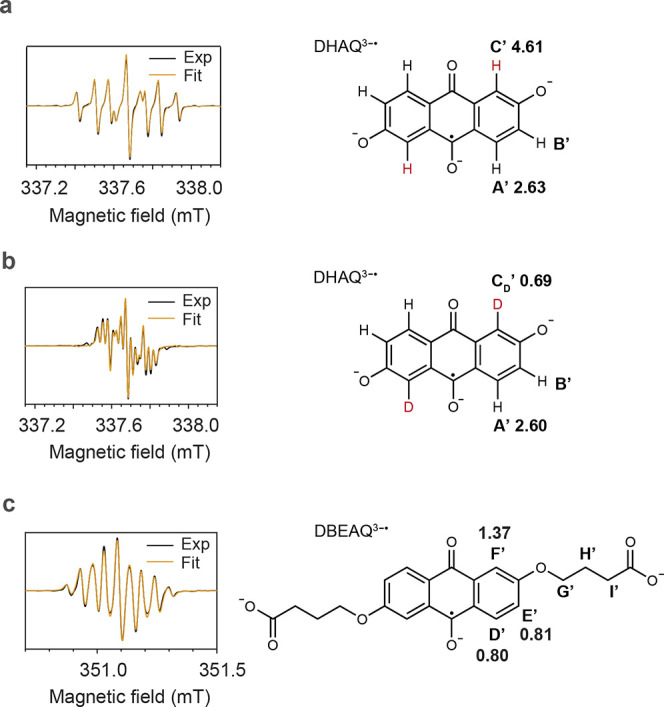
EPR spectra of DHAQ3–• and DBEAQ3–• radical anions. (a) Spectrum of the anolyte from a 1 mM DHAQ versus 20 mM K4[Fe(CN)6] and 10 mM K3[Fe(CN)6] full cell after 10 galvanostatic cycles. The solvent was H2O with 1 M KOH as the supporting electrolyte. The spectrum was acquired at 50% SOC during the last discharge cycle. The linewidth used in the final fit is 0.0121 mT with Gaussian broadening. (b) Spectrum of the anolyte from a full cell acquired under the same conditions as in (a) except that D2O was used as the solvent. The linewidth used in the final fit is 0.0116 mT with Gaussian broadening. (c) Spectrum of the anolyte from a 1 mM DBEAQ versus 20 mM K4[Fe(CN)6] and 10 mM K3[Fe(CN)6] full cell acquired at 50% SOC. D2O and 1 M KOH were used as the solvent and supporting electrolyte, respectively. The linewidth used in the final fit is 0.0100 mT with Gaussian broadening. The molecular structures used for the fits are shown to the right to each spectrum, together with the proton or deuterium labels and their associated hyperfine coupling constants (in MHz) extracted from the fit. The values of the g-factors for DHAQ3–• and DEBAQ3–• are 2.0046 and 2.0049, respectively.