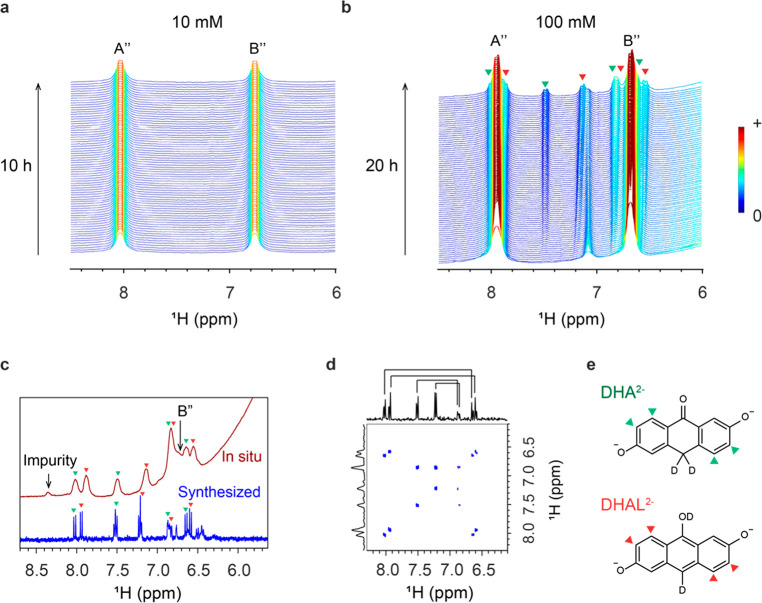
Figure 6.
NMR analyses of electrolyte decomposition at two different concentrations. (a) 1H NMR spectra of 10 mM DHAQ during a voltage hold at 1.7 V for 10 h. (b) 1H NMR spectra of 100 mM DHAQ during a voltage hold at 1.7 V for 20 h. The green and red triangles highlight the signals of the decomposition products, DHA2– or DHAL2– anions, respectively. (c) In situ1H NMR spectrum acquired immediately after the voltage hold was stopped and the discharge started (top spectrum, red), and ex situ1H NMR spectrum of 10 mM as-synthesized DHA2– or DHAL2– dissolved in D2O with 1 M KOH (bottom spectrum, blue). The DHA2– and DHAL2– signals are highlighted by the green triangles. (d) COSY spectrum of the 10 mM as-synthesized DHA2– or DHAL2–. (e) Molecular structures of the DHA2– or DHAL2– anions.

