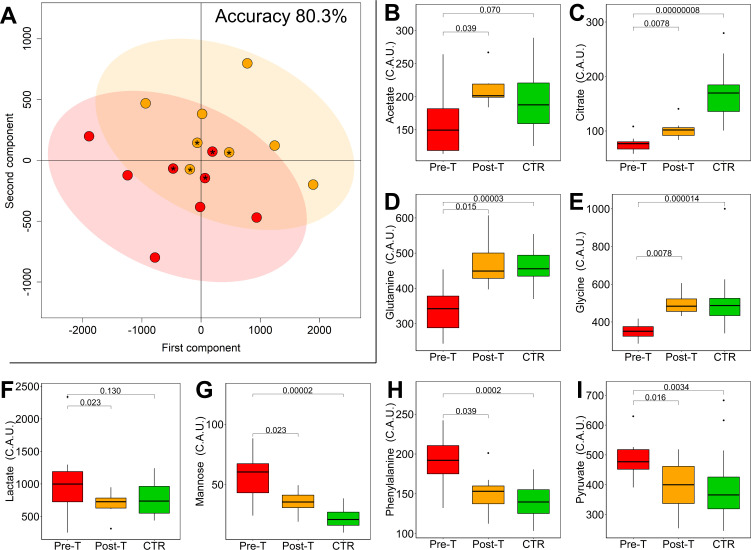
Fig 3. Tocilizumab treatment reverts metabolomic/lipidomic alterations in COVID-19 patients.
(A) Score plot (of the first two principal components) and accuracy of the mPLS-DA model discriminating COVID-19 patients at pre- (red dots) and post- (orange dots) tocilizumab treatment using the 21 quantified metabolites. Patients 18, 20 and 21 are marked with *. (B-I) Boxplots of the statistically significant metabolites discriminating of pre- (red) and post- (orange) tocilizumab samples, p-values obtained using Wilcoxon signed-rank test are also reported. Boxplots of controls (green) and the p-values (Wilcoxon-Mann-Whitney test) for the comparison between pre-treatment and CTR are reported. P-values adjusted for FDR are reported in S5 Table.

