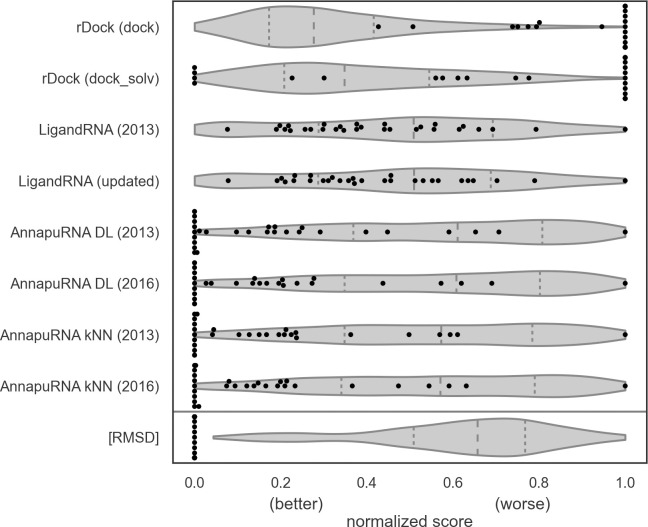
Fig 3. Comparison of scores of the experimentally determined ligand structures (black dots) with the distribution of scores of docked poses (gray violin plots) for the testing set.
Additional row [RMSD] represents the distribution of the RMSD values for docked poses and experimentally determined structures. Docking scores and RMSD values were normalized independently for each complex to values [0, 1]. The quartiles of the distribution are marked by the inner vertical dashed lines. Docking was performed using rDock with dock desolvation potential with the native conformation of a ligand as an input.

