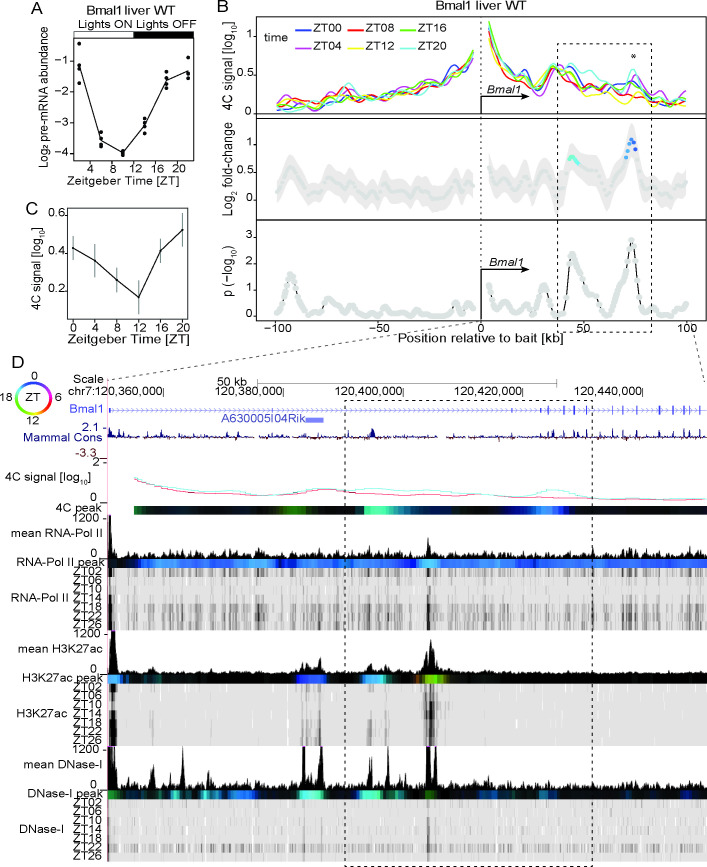
Fig 1. Time-resolved 4C-seq experiments revealed 24h rhythms in chromatin interactions at the Bmal1 (Arntl) promoter in WT mouse liver.
(A) Bmal1 pre-mRNA expression over time in WT mouse liver [47]. (B) 4C-seq signal over time from the Bmal1 TSS bait in WT mouse liver (top panel) and log2 fold change (middle panel) and −log10(p) (lower panel, Material and Methods) for rhythmicity analyses [23]. Fragments with p<0.01 are colored according to peak time in contact frequency (color-coding as in following top left circle panel D). * = local maximum in differential genomic contact. n=1 in ZT04/ZT12/ZT20, n=2 in ZT00/ZT08/ZT16. Dashed rectangle: region of rhythmic interaction. (C) 4C-seq signal over time, adjacent to * (B). (D) 4C-seq signal at ZT20 (blue) and ZT08 (red), time-resolved ChIP-seq signal for PolII, H3K27ac and DNase1 hypersensitivity in WT mouse liver [8]. Color-coded tracks represent peak time for 4C-seq signal and chromatin marks (see top left circle for time code, methods). Dashed rectangle: region of rhythmic interaction. Localized genomic regions marked by ZT18 to ZT00 H3K27ac and DNase1 hypersensitivity make chromatin contacts with the promoter region of Bmal1 at ZT20. See S7A Fig for ChIP-seq signals of CTCF and core clock factors at the connected genomic regions.

