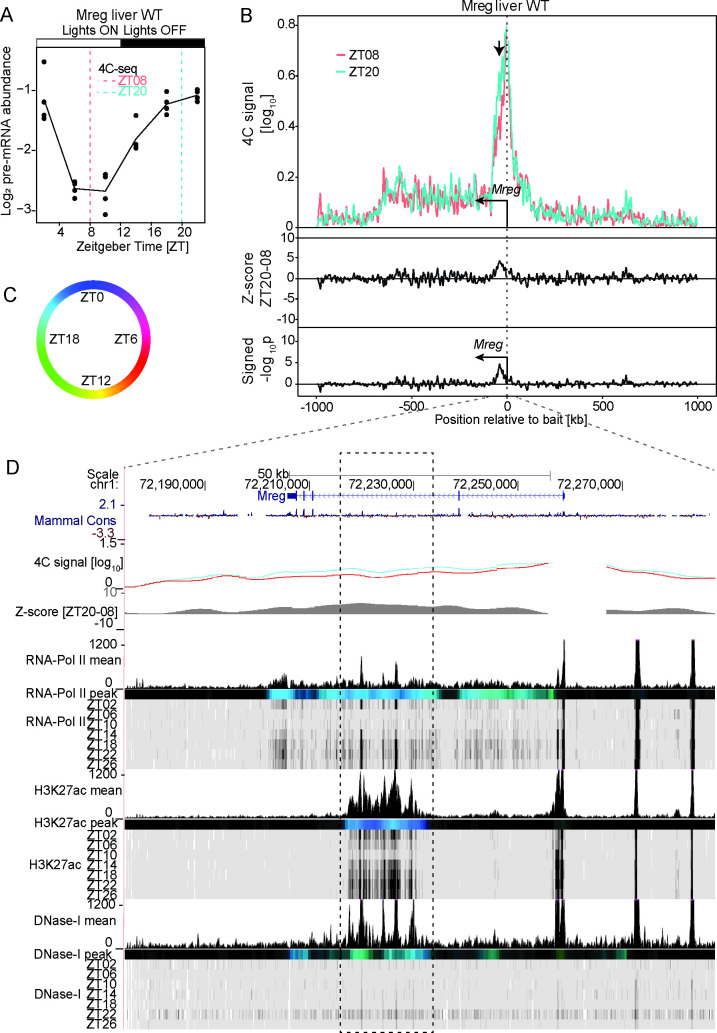
Fig 3. Oscillating interactions between the Mreg promoter and an intragenic enhancer-like elements.
(A) Mreg pre-mRNA expression over time in WT mouse liver [47]. (B) 4C-seq signal at ZT08 (red, n=2) and ZT20 (green, n=2) in WT mouse liver in a 2Mb genomic window surrounding the Mreg bait position (upper panel) and the corresponding Z-scores (middle track) and p-values (lower track) revealing a ZT20 preferential contact within a region located from ~30 kb to ~40 kb downstream of the bait position (arrow). (C and D) Genome browser view with the Mreg 4C-seq signal at ZT08 (red) and ZT20 (blue) and time-resolved ChIP-seq signal for PolII, H3K27ac and DNase1 hypersensitivity in WT mouse liver (D) [8]. Colored tracks represent peak time in chromatin marks following the color code as in (C) (Material and Methods). Dashed rectangle: region of rhythmic interaction. The interacting region spanning from ~30 kb ~40 kb downstream of the Mreg TSS is marked by rhythms in DHSs and H3K27ac peaking around ZT20, in sync with Mreg transcription. See S8B Fig for ChIP-seq signals of CTCF and core clock factors at the connected genomic regions.

