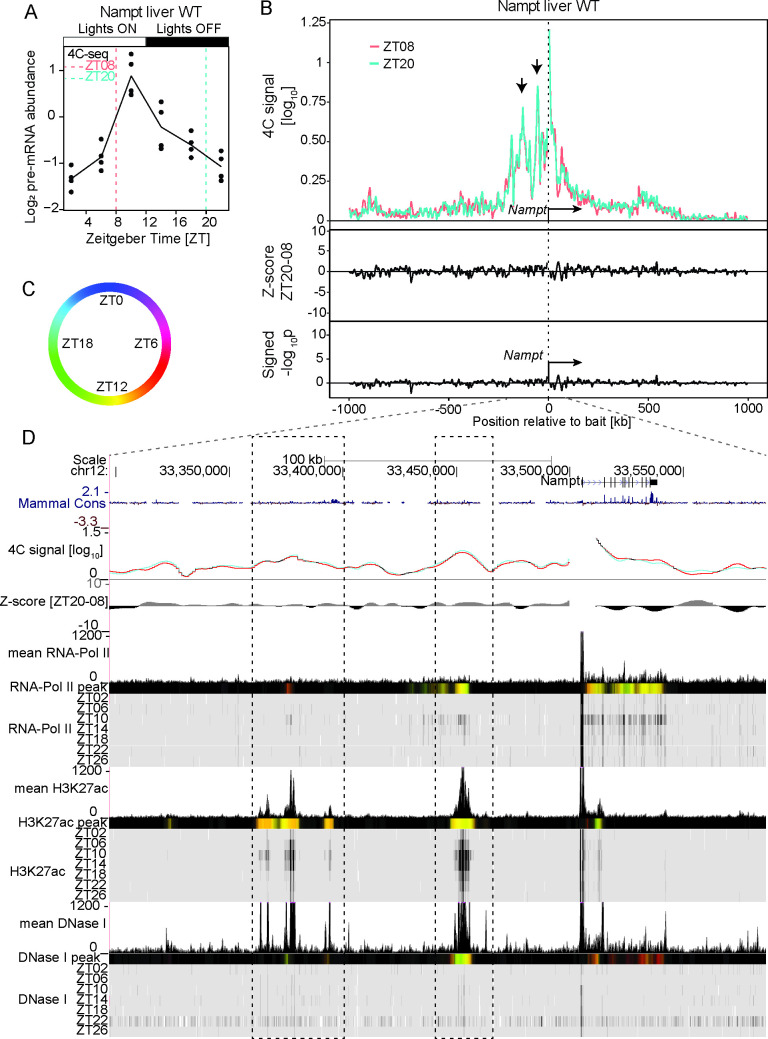
Fig 4. The Nampt promoter connects enhancer-like distal elements having rhythmic chromatin modifications.
(A) Nampt pre-mRNA accumulation over time in WT mouse liver from [47]. (B) 4C-seq signal at ZT08 (red, n=2) and ZT20 (green, n=4) in WT mouse liver in a 2Mb genomic window surrounding the Nampt bait (upper panel) and the corresponding Z-scores (middle track) and p-values (lower track). The most prominent 4C-seq peaks are located ~50 kb and ~125 kb upstream of the bait position (arrows). (C and D) Genome browser view with the Nampt 4C-seq signal at ZT08 (red) and ZT20 (blue) and time-resolved ChIP-seq signal for PolII, H3K27ac and DNase1 hypersensitivity in WT mouse liver [8] (D). Genomic regions located 50 kb and 125 kb upstream of the Nampt TSS are marked with DHSs and oscillating signals in H3K27ac peaking around ZT12, in sync with the transcription of Nampt. Colored tracks represent peak time in 4C-seq signal and chromatin mark (color code in C, Material and Methods). Dashed rectangle: region of highest interaction frequency. See S9A Fig for ChIP-seq signals of CTCF and core clock factors at the connected genomic regions.

