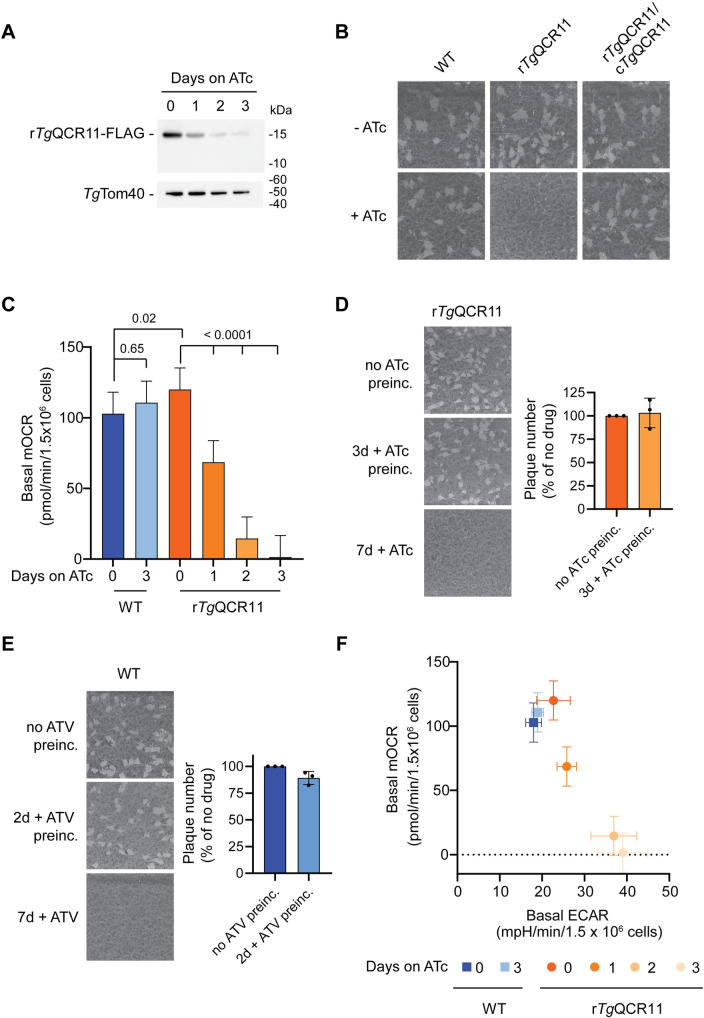
Fig 4. The apicomplexan-specific Complex III subunit TgQCR11 is important for parasite proliferation and mitochondrial oxygen consumption.
(A) Western blot of proteins extracted from rTgQCR11-FLAG/TgMPPα-HA parasites grown in the absence of ATc, or in the presence of ATc for 1–3 days, separated by SDS-PAGE, and detected using anti-FLAG and anti-TgTom40 antibodies (loading control). (B) Plaque assays measuring growth of WT, rTgQCR11-FLAG/TgMPPα-HA and complemented cTgQCR11-Ty1/rTgQCR11-FLAG/TgMPPα-HA parasites cultured in the absence (top) or presence (bottom) of ATc for 8 days. Assays are from a single experiment and are representative of 3 independent experiments. (C) Basal mitochondrial oxygen consumption rates (mOCR) of WT parasites grown in the absence of ATc or in the presence of ATc for 3 days (blue), and rTgQCR11-FLAG/TgMPPα-HA parasites grown in the absence of ATc or in the presence of ATc for 1–3 days (orange). A linear mixed-effects model was fitted to the data and values depict the least squares mean ± 95% CI of three independent experiments. ANOVA followed by Tukey’s multiple pairwise comparisons test was performed, with relevant p values shown. (D) Plaque assays of rTgQCR11-FLAG parasites grown in the absence of ATc (no ATc preinc; top) for 7 days, pre-incubated in ATc for 3 days before washing out and growing for a further 7 days in the absence of ATc (3d + ATc preinc; middle), or grown in the presence of ATc for all 7 days (7d + ATc; bottom). Quantifications of plaque number as a percent of the no ATc control are depicted to the right of the plaque assays, with bars representing the mean ± standard deviation of 3 independent experiments. (E) Plaque assays of WT parasites grown in the absence of atovaquone (no ATV preinc; top), pre-incubated in ATV for 2 days before washing out and growing for 7 days in the absence of ATV (2 days + ATV preinc; middle), or grown in the presence of ATV for all 7 days (7d + ATV; bottom). Quantifications of plaque number as a percent of the no ATV control are depicted to the right of the plaque assays, with bars representing the mean ± standard deviation of 3 independent experiments. (F) Basal mOCR versus basal extracellular acidification rate (ECAR) of WT parasites grown in the absence of ATc or in the presence of ATc for 3 days (blue), and rTgQCR11-FLAG/TgMPPα-HA parasites grown in the absence of ATc or in the presence of ATc for 1–3 days (orange). Data depict the mean mOCR and ECAR values ± 95% CI of the linear mixed-effects model (n = 3).

