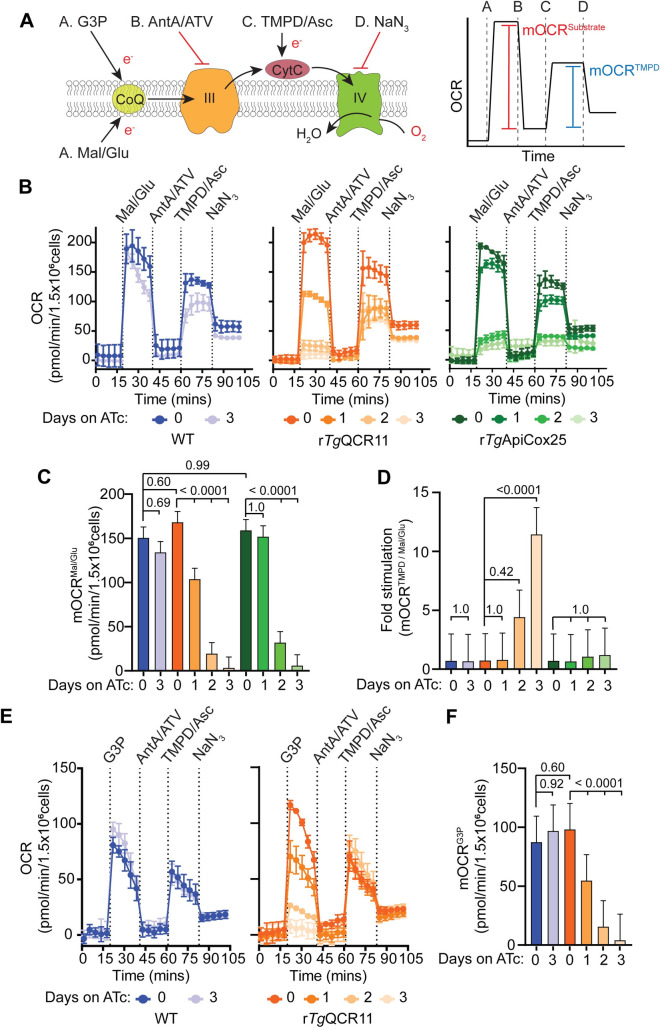
Fig 5. Loss of TgQCR11 leads to a specific defect in Complex III function.
(A) Schematic diagram of the assay measuring OCR in digitonin-permeabilized parasites, with inset (right) depicting a mock oxygen consumption rate (OCR) versus time graph to illustrate the typical response of WT parasites. Parasites are starved for 1 hour in base media to deplete endogenous energy sources, then permeabilized with 0.002% (w/v) digitonin before being subjected to the following injections of substrates or inhibitors: Port A, malate and glutamate (Mal/Glu) or glycerol 3-phopshate (G3P); Port B, antimycin A and atovaquone (AntA/ATV); Port C, TMPD and ascorbate (TMPD/Asc); Port D, sodium azide (NaN3). The mitochondrial OCR (mOCR) elicited by a substrate (red line, mOCRsubstrate) and the mOCR elicited by TMPD/Asc (blue line, mOCRTMPD) are then calculated from these data. CytC, cytochrome c; CoQ, coenzyme Q; III, Complex III; IV, Complex IV; e-, electrons. (B) Representative traces depicting OCR over time when supplying Mal/Glu (10 mM) as an energy source. WT (blue), rTgQCR11-FLAG/TgMPPα-HA (orange) and rTgApiCox25-HA (green) parasites were grown in the absence of ATc or in the presence of ATc for 1–3 days. Data represent the mean ± SD of three technical replicates, and are representative of three independent experiments. (C) Mal/Glu elicited mOCR (mOCRMal/Glu) of WT (blue), rTgQCR11-FLAG/TgMPPα-HA (orange) and rTgApiCox25-HA (green) parasites that were grown in the absence of ATc or in the presence of ATc for 1–3 days. A linear mixed-effects model was fitted to the data and values depict the least squares mean ± 95% CI from three independent experiments. ANOVA followed by Tukey’s multiple pairwise comparisons test was performed, with relevant p values shown. (D) Fold stimulation of mOCR by TMPD relative to Mal/Glu in WT (blue), rTgQCR11-FLAG/TgMPPα-HA (orange) and rTgApiCox25-HA (green) parasites that had been grown in the absence of ATc or in the presence of ATc for 1–3 days (mean ± 95% CI of the linear mixed-effects model; n = 3). ANOVA followed by Tukey’s multiple pairwise comparisons test was performed, with relevant p values shown. (E) Representative traces depicting OCR over time when supplying the TCA cycle-independent substrate G3P (10 mM) as an energy source. WT (blue) and rTgQCR11-FLAG/TgMPPα-HA (orange) parasites were grown in the absence of ATc or in the presence of ATc for 1–3 days. Data represent the mean ± SD of three technical replicates, and are representative of three independent experiments. (F) G3P elicited mOCR (mOCRG3P) of WT (blue) and rTgQCR11-FLAG/TgMPPα-HA (orange) parasites that were grown in the absence of ATc or in the presence of ATc for 1–3 days (mean ± 95% CI of the linear mixed-effects model; n = 3). ANOVA followed by Tukey’s multiple pairwise comparisons test was performed, with relevant p values shown.

