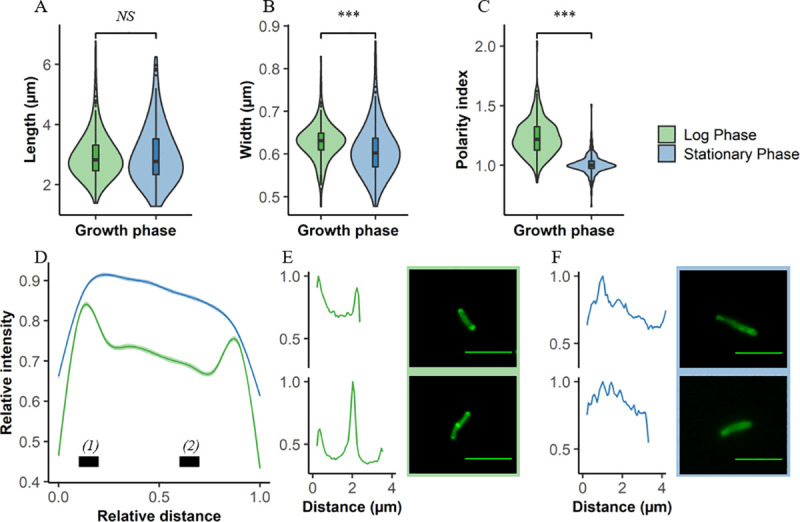
Fig 2. Differentiation of growth states in Mtb using DMN-trehalose and cell morphology.

Comparisons between log (green) and stationary (blue) phase Mtb according to (A) cell length, (B) width, and (C) polarity index. (D) Average DMN-trehalose profile for log and stationary phase bacilli, with single-cell examples in both (E) log and (F) stationary phase. Polarity index for each cell was calculated as the median fluorescence intensity at region (1) divided by the median fluorescence intensity at region (2) in panel (D). Wilcoxon signed-rank test performed, p < 0.001 = ***, NS = not significant.
