
Extended Data Figure 7. RNA sequencing analysis of Col1a1-GFP+ cells from the spinal cord in health and EAE.
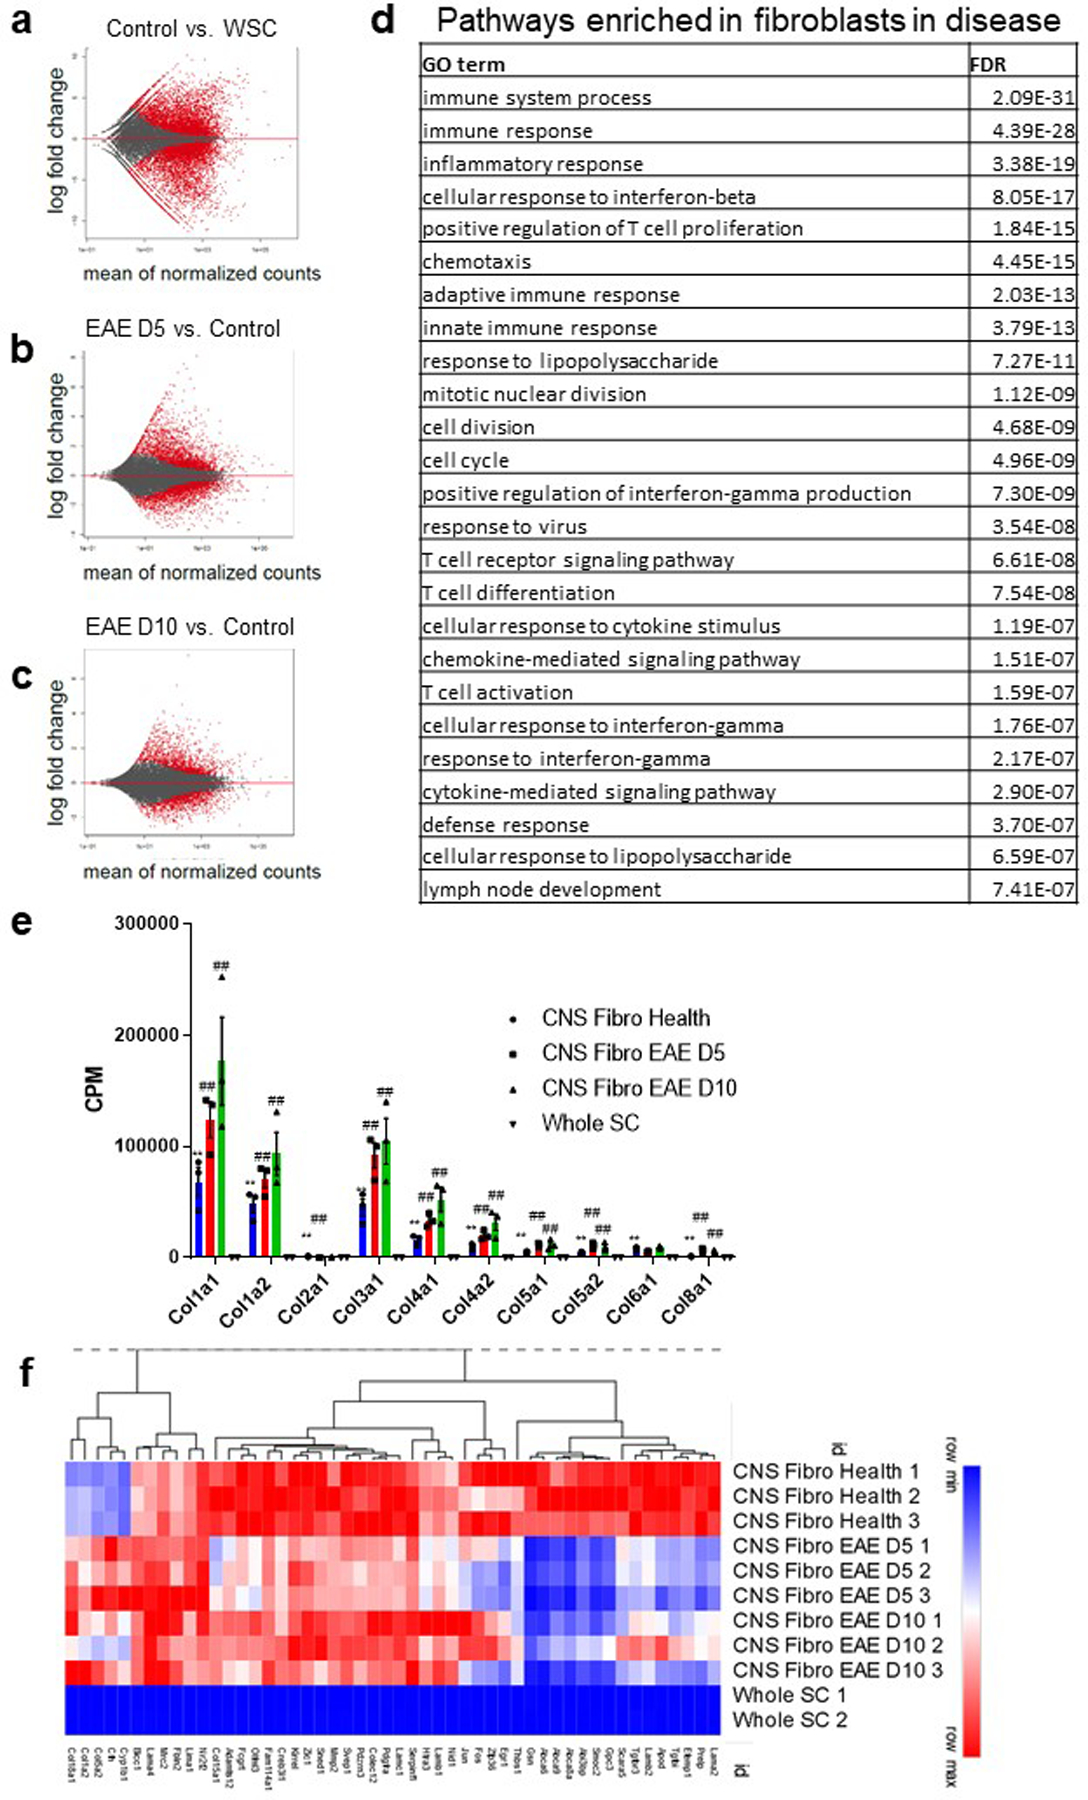
a–c. MA plots comparing the transcriptome of CNS fibroblasts in health with whole spinal cord tissue (a), CNS fibroblasts in health with CNS fibroblasts EAE D5 (b) or D10 (c) PSO with red dots signifying genes with FDR < 0.1. d. Pathway analysis using DAVID Bioinformatics Resources 6.8, NIAID/NIH, GOTERM_BP_DIRECT for genes with a log2 fold change greater than 2 for CNS fibroblasts EAE D5 PSO compared to CNS fibroblasts in health. e. CPM of collagen genes from the bulk sequencing of whole spinal cord tissue (Whole SC, n = 2), CNS fibroblasts from health (CNS Fibro Health, n = 3) CNS fibroblasts 5 days PSO (CNS Fibro EAE D5, n = 3) and 10 days PSO (CNS Fibro EAE D10, n = 3), ± s.e.m., *FDR < 0.05, **FDR < 0.01 to Whole SC, #FDR < 0.05, ##FDR < 0.01 to CNS Fibro Health. f. Heat map of the expression levels of the top genes differentially expressed in CNS Fibro Health (each expressed at least 1 CPM in each control sample) compared to the whole spinal cord by FDR.