
Figure 3: Scar-forming cells have the transcriptional profile of fibroblasts at the single cell level.
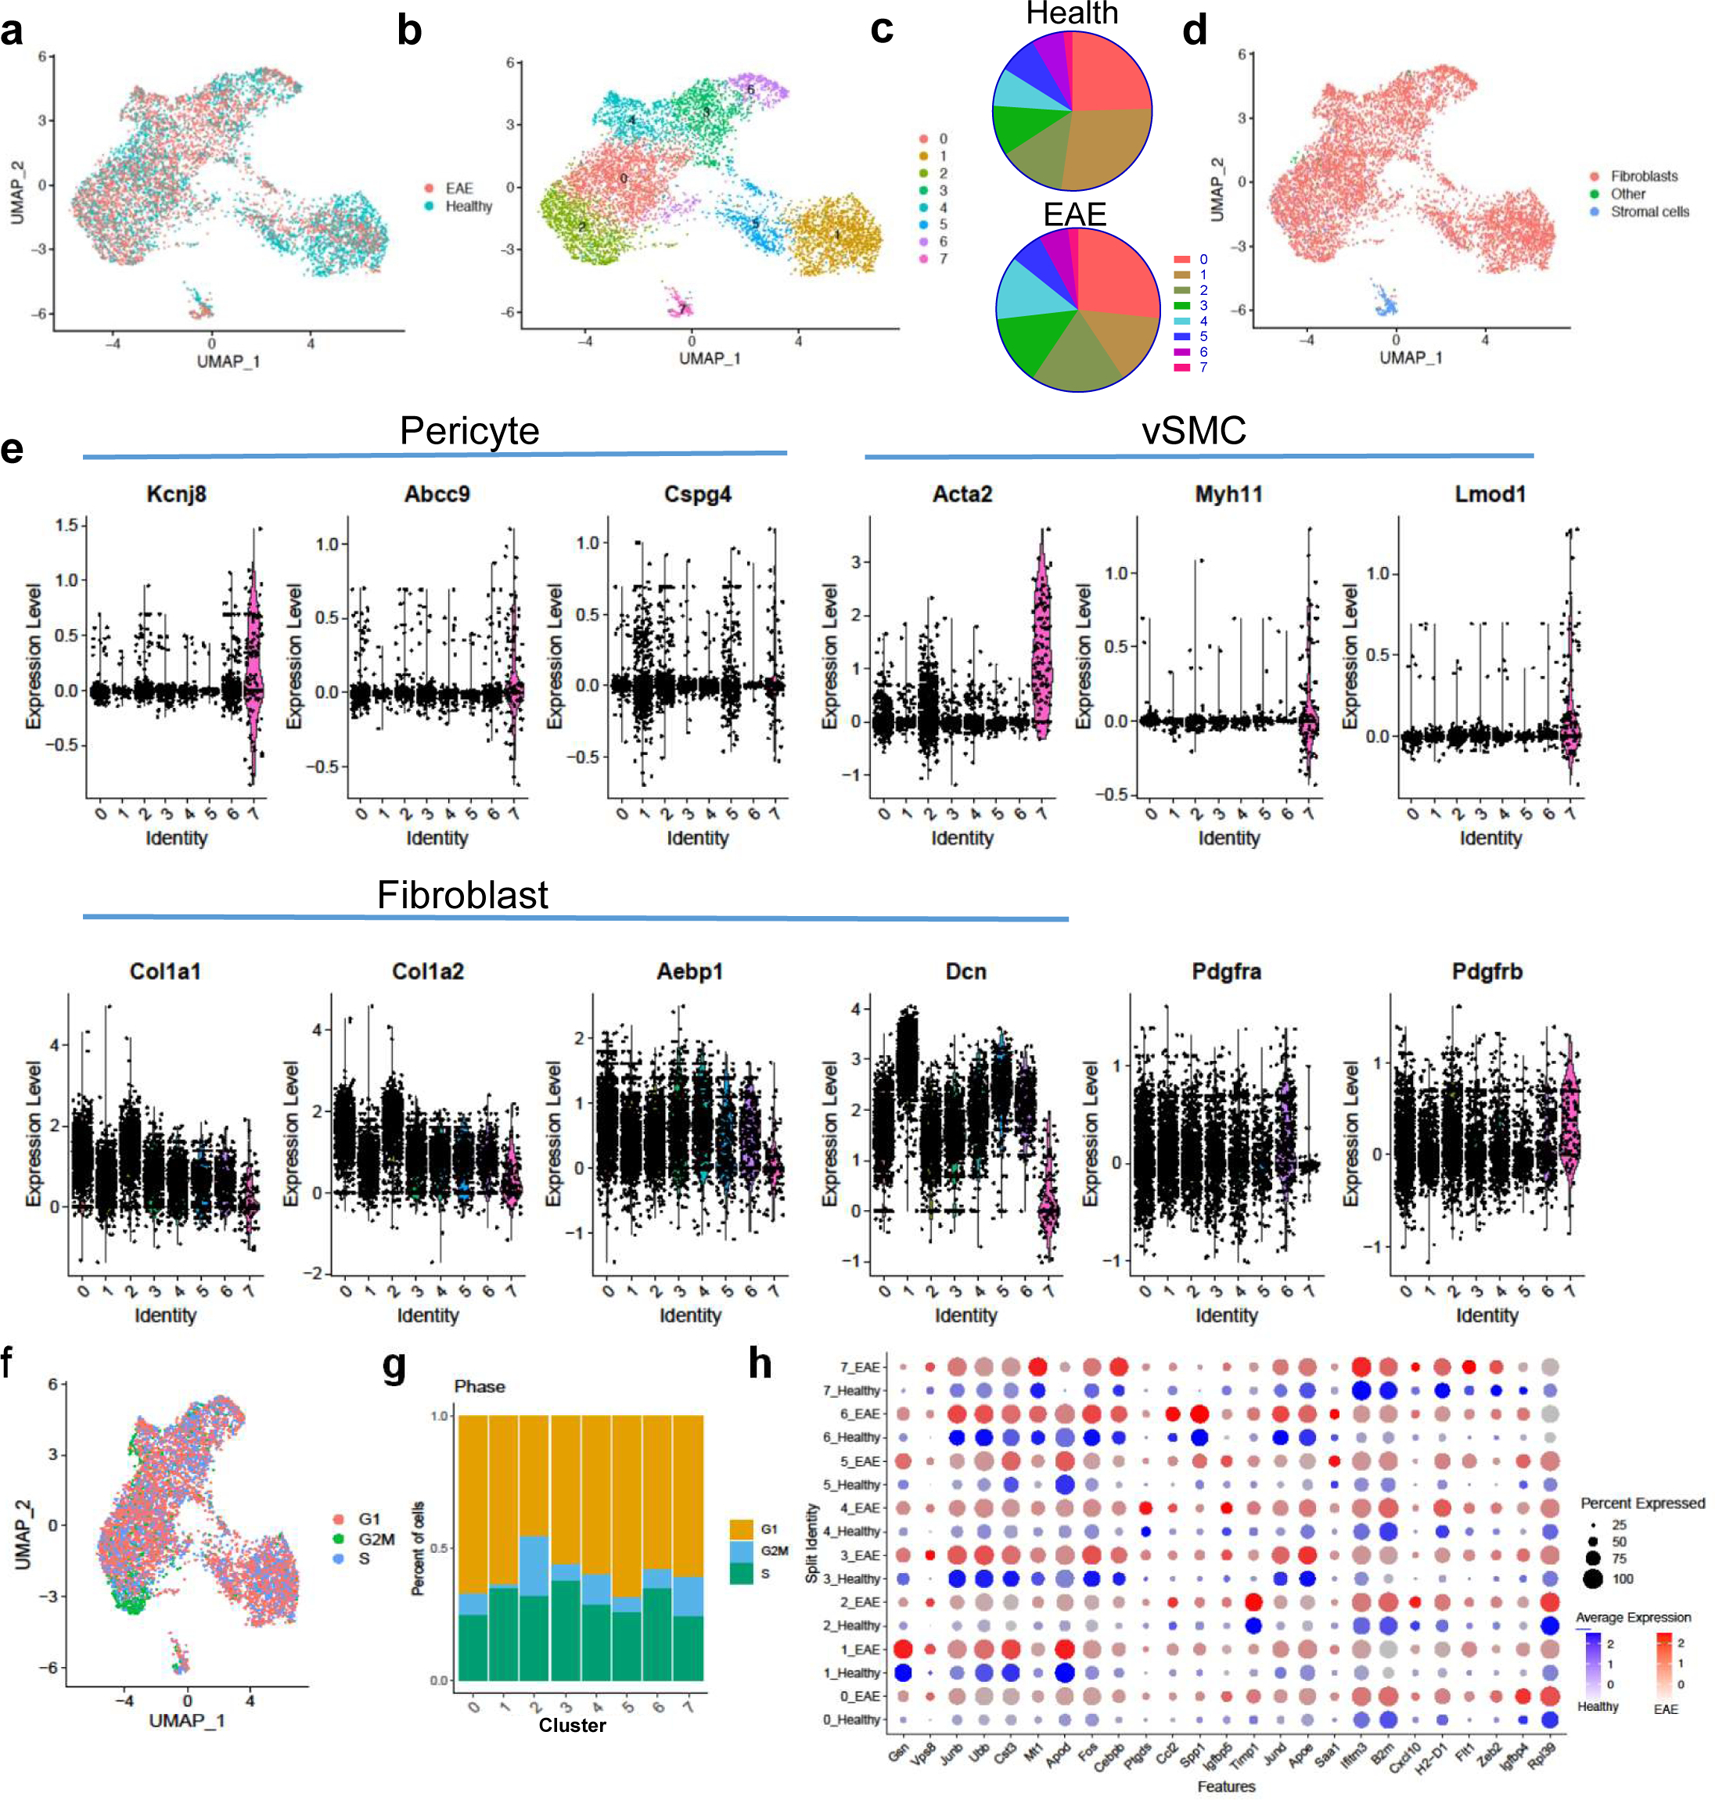
a–d. Col1a1-GFP+ cells from spinal cords of healthy mice (n=3 samples with 2–3 spinal cords each) and mice with EAE 5–7 days PSO (n=2 samples, 2 spinal cords each) were transcriptionally profiled at the single cell level and clustered using Seurat v3. a. UMAP plot with the sample identity (Health vs. EAE) labeled for each cell. b. UMAP plot of the clustering analysis reveals 8 clusters that could be subdivided into three classes: Class 1 (clusters 0,2,3,4,6), Class 2 (clusters 1,5), and Class 3 (cluster 7). c. Pie charts showing the percentage of each cluster relative to the total number of cells in health or EAE. d. UMAP plot with each cell labeled with its cellular identity determined using SingleR and the Immgen reference dataset. e. Violin plots of the expression levels of pericyte, vSMC and fibroblast-specific genes per cluster. f. UMAP plot showing the transcriptional cell cycle identity per cell. g. Bar graph showing the percentage of transcriptional signatures of the different steps of the cell cycle in each cluster. h. Dot plot of selected genes that are expressed at greater levels in EAE than in health in at least one cluster.