
Figure 4: Reducing fibrotic scar formation reduces disease severity in EAE.
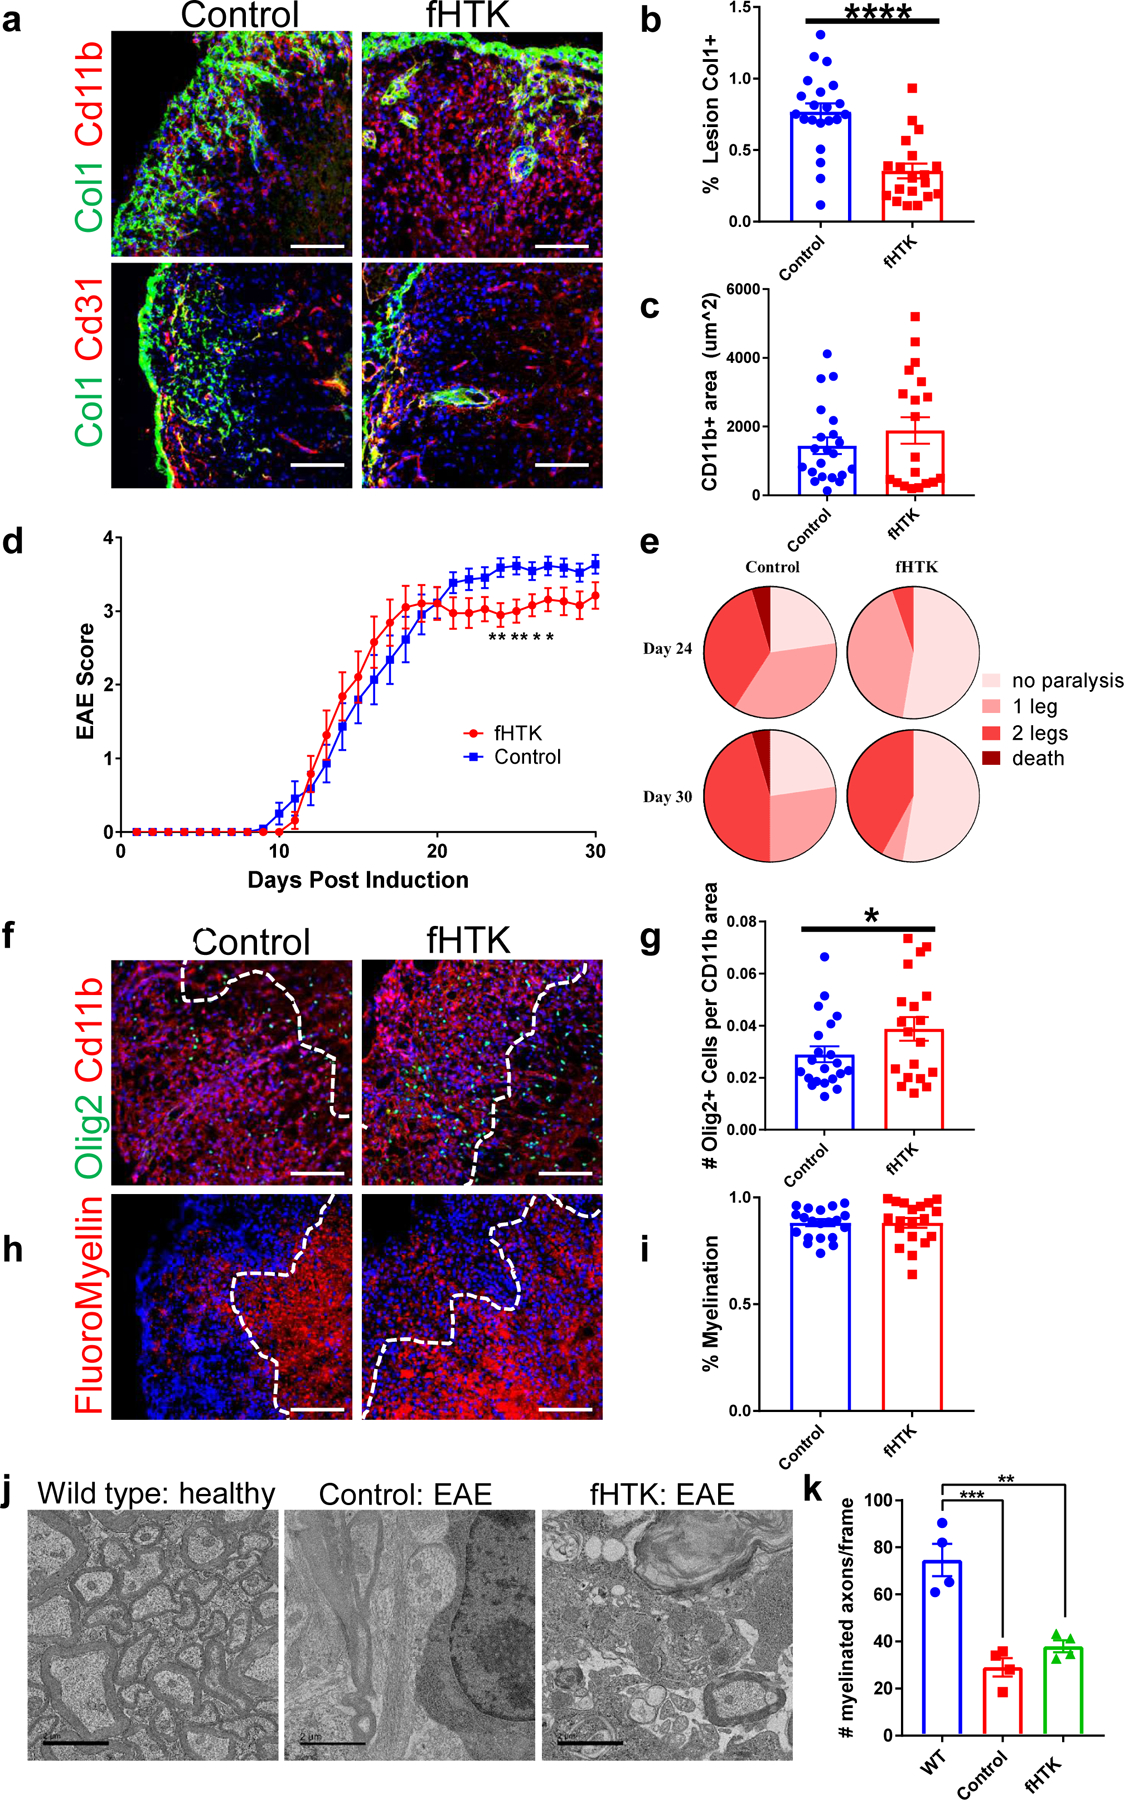
a. Spinal cord sections from fibrotic cell-specific herpes thymidine kinase (fHTK) mice and littermate controls 30 days after EAE immunization were stained for Col1 (green), DAPI (blue) and CD11b (top, red) to label immune cells or CD31 (bottom, red) to label endothelial cells. b. Quantification of the percentage of the area of immune infiltration (denoted by CD11b) that is Col1+, ± s.e.m., **p <0.0001 by Student’s two-tailed t-test, n=21 control, 19 fHTK. c. Quantification of the total lesion size, denoted by Cd11b staining, ± s.e.m., n = 21 control, 19 fHTK, p = 0.33 by Student’s two-tailed t-test. d. EAE score for the fHTK mice and controls up to 30 days post EAE induction, ± s.e.m., **p<0.01, *p <0.05 by two-tailed Mann-Whitney test, n=22 control, 19 fHTK. e. Pie charts depicting the percentages of control and fHTK mice that were paralyzed at day 24 and day 30 post EAE induction. f. Spinal cords from control and fHTK mice were stained for OLIG2 (green), CD11b (red) and DAPI (blue) with the area of the CD11b+ lesion traced with a dotted white line. g. The number of OLIG2+ cells per CD11b+ lesion was quantified comparing the fHTK and control mice, ± s.e.m., n = 21 control, 19 fHTK, *p = 0.038 by Student’s one-tailed t-test. h. Spinal cord sections from fHTK mice and controls at 30 days post EAE induction were stained for FluoroMyelin (red) and DAPI (blue) with the area of the CD11b+ lesion traced with a dotted white line. i. Quantification of the percentage of the total white matter area that is FluoroMyelin positive, ± s.e.m., n = 21 control, 19 fHTK, p = 0.96 by Student’s two-tailed t-test. j. Electron microscopy images of spinal cord sections from healthy wild type mice, and fHTK mice and control mice both at 30 days post EAE induction. k. Quantification of the # of myelinated axons from the 3 groups per 3000x picture frame, n = 4 per group, ***p = 0.0002, **p = 0.0012, using a one-way ANOVA with multiple comparisons. Scale bars for immunofluorescence images = 100 µm, scale bars for EM images = 2 µm.