
Extended Data Figure 3. Col1a2CreERT and NG2CreERTM reporter expression.
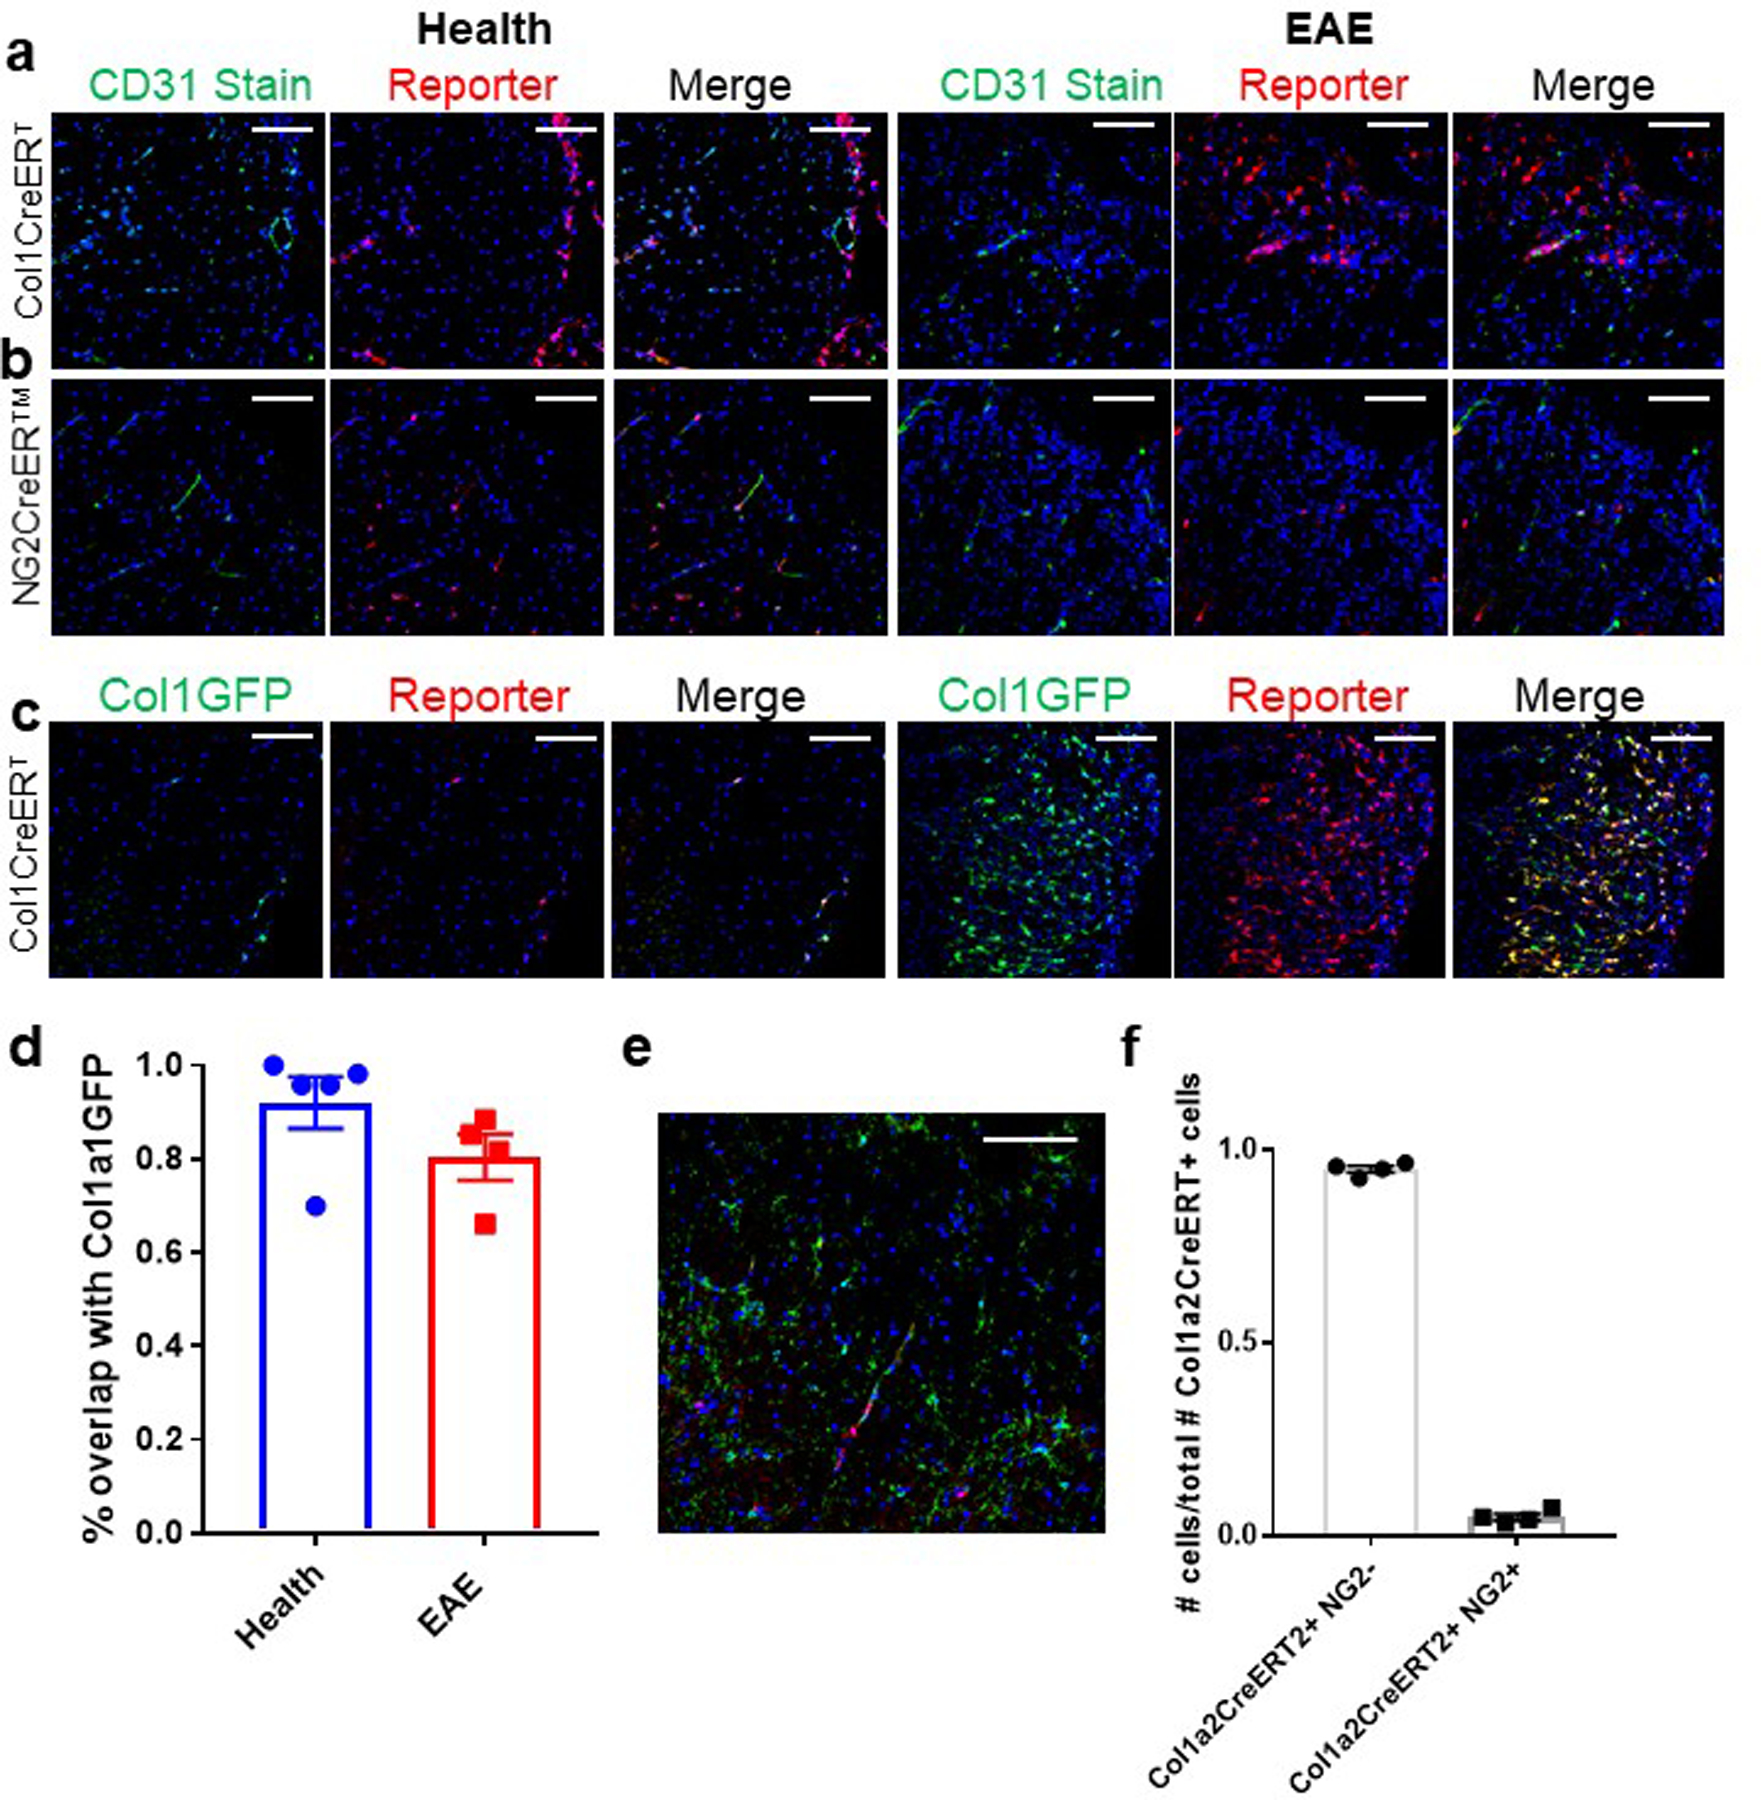
Spinal cords of Col1a2CreERT;Rosa-tdTomato (a) or NG2CreER™;Rosa-tdTomato (b) mice in health or EAE 10 d PSO were stained with CD31 in green and DAPI in blue. Scale bars = 100 µm. c. Spinal cords of Col1a2CreERT;Rosa-tdTomato;Col1a1-GFP mice in health or 10 days EAE PSO were imaged for both reporters. The percentage of Col1a1-GFP+ cells that were also positive for the tomato reporter in health and EAE is quantified in (d), ± s.e.m., n = 5 health, 4 EAE. e. Col1a2CreERT;Rosa-tdTomato mice were stained with NG2 in red, and the proportion of Col1a2CreERT+ cells that were NG2+ and NG2− were quantified in (f), ± s.e.m., n = 4. Scale bars = 100 µm