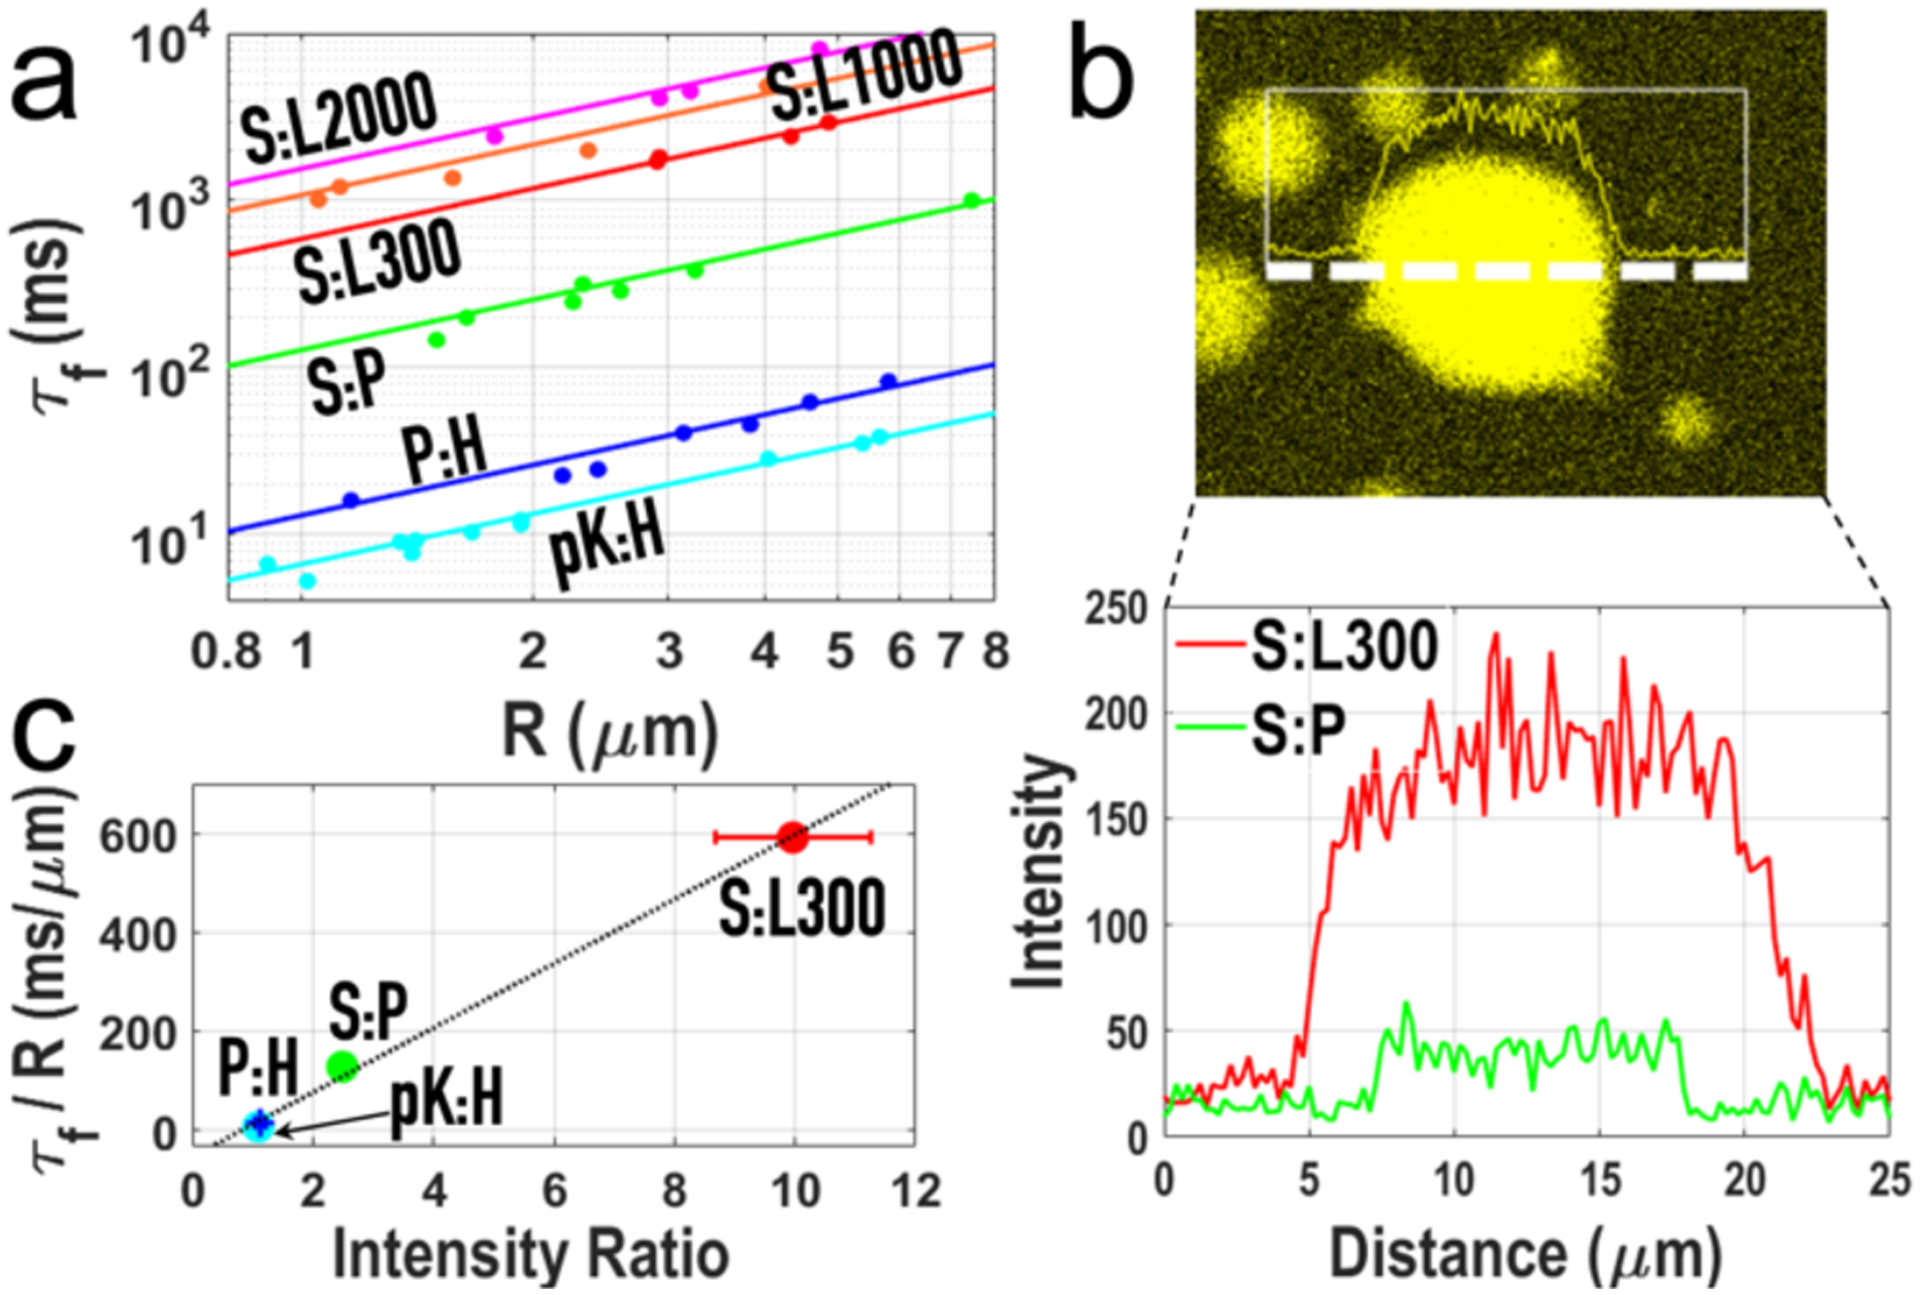
Figure 2.

Correlation of fusion time with ThT fluorescence intensity. a) Proportional relation between fusion time (τf) and droplet radius (R). Errors bars (representing the uncertainties in τf as a parameter in fitting force traces to a stretched exponential are smaller than the size of the symbols. b) A line scan of ThT fluorescence across 34 μm through an S:L droplet, and the intensity profiles for this S:L droplet and for an S:P droplet, illustrating the contrast in ThT fluorescence between these droplets. c) Linear relation between τf/R and the ratio of ThT fluorescence intensities inside and outside droplets. Error bars in τf/R represent the uncertainties in the slope of the linear fit in panel a); error bars in intensity ratio are standard deviations of replicate measurements (n = 5 – 8). Some errors are not visible because they are smaller than the size of the symbols.
