
Figure 2.
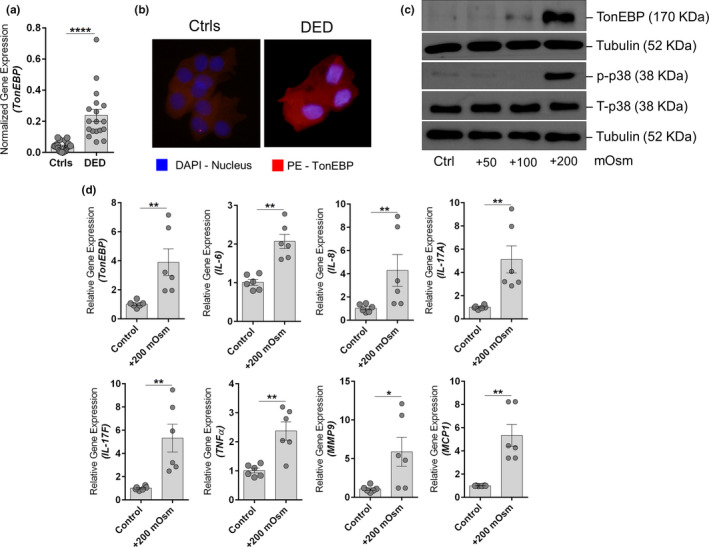
Hyperosmotic stress status and effects in patients with dry eye disease (DED) and human corneal epithelial cells (HCECs). (a) Graphs indicate the mRNA expression level of TonEBP normalized to expression of GAPDH (housekeeping gene) in conjunctival impression cytology (CIC) samples of control (Ctrl) subjects (n = 11) and patients with DED (n = 9). Scatter plot with bar indicates mean ± SEM and data points from two technical replicates for each subject. ****P < 0.0001, Mann–Whitney U test. (b) The panels exhibit the protein expression TonEBP in cells obtained by CIC from control subjects (n = 3) and patients with DED (n = 3) using immunofluorescence (40× magnification; DAPI – nuclear stain; PE – TonEBP). Images shown are representative of three different fields from three subjects in each group. Note: Sufficient cells for immunofluorescence imaging from CIC samples could only be obtained from three of the six CIC samples collected from DED subjects. (c) Panels shows the protein level of TonEBP, phosphorylated p38, total p38, and tubulin in HCECs following exposure to different doses of hyperosmotic stress (+50 mOsm, +100 mOsm, and +200 mOsm) for 24 hours in vitro. Tubulin was used as protein loading controls. The blots shown are representative images of three independent experiments. (d) Graphs indicate mean mRNA expression of TonEBP, IL‐6, IL‐8, IL‐17A, IL‐17F, TNFα, MMP9, and MCP1 normalized to expression of β‐Actin (housekeeping gene) in human HCECs in vitro following exposure to hyperosmotic stress (+200 mOsm) for 6 hours. The categories include untreated cells (Ctrl), cells under hyperosmotic stress (+200 mOsm). Scatter plot with bar indicates mean ± SEM and data points from two technical replicates for each of the three independent experiments. *P < 0.05, **P < 0.01, Mann–Whitney U test. The graphs shown in panel (d) are controls and + 200 mOsm groups from experiments shown in Figure S4 b.