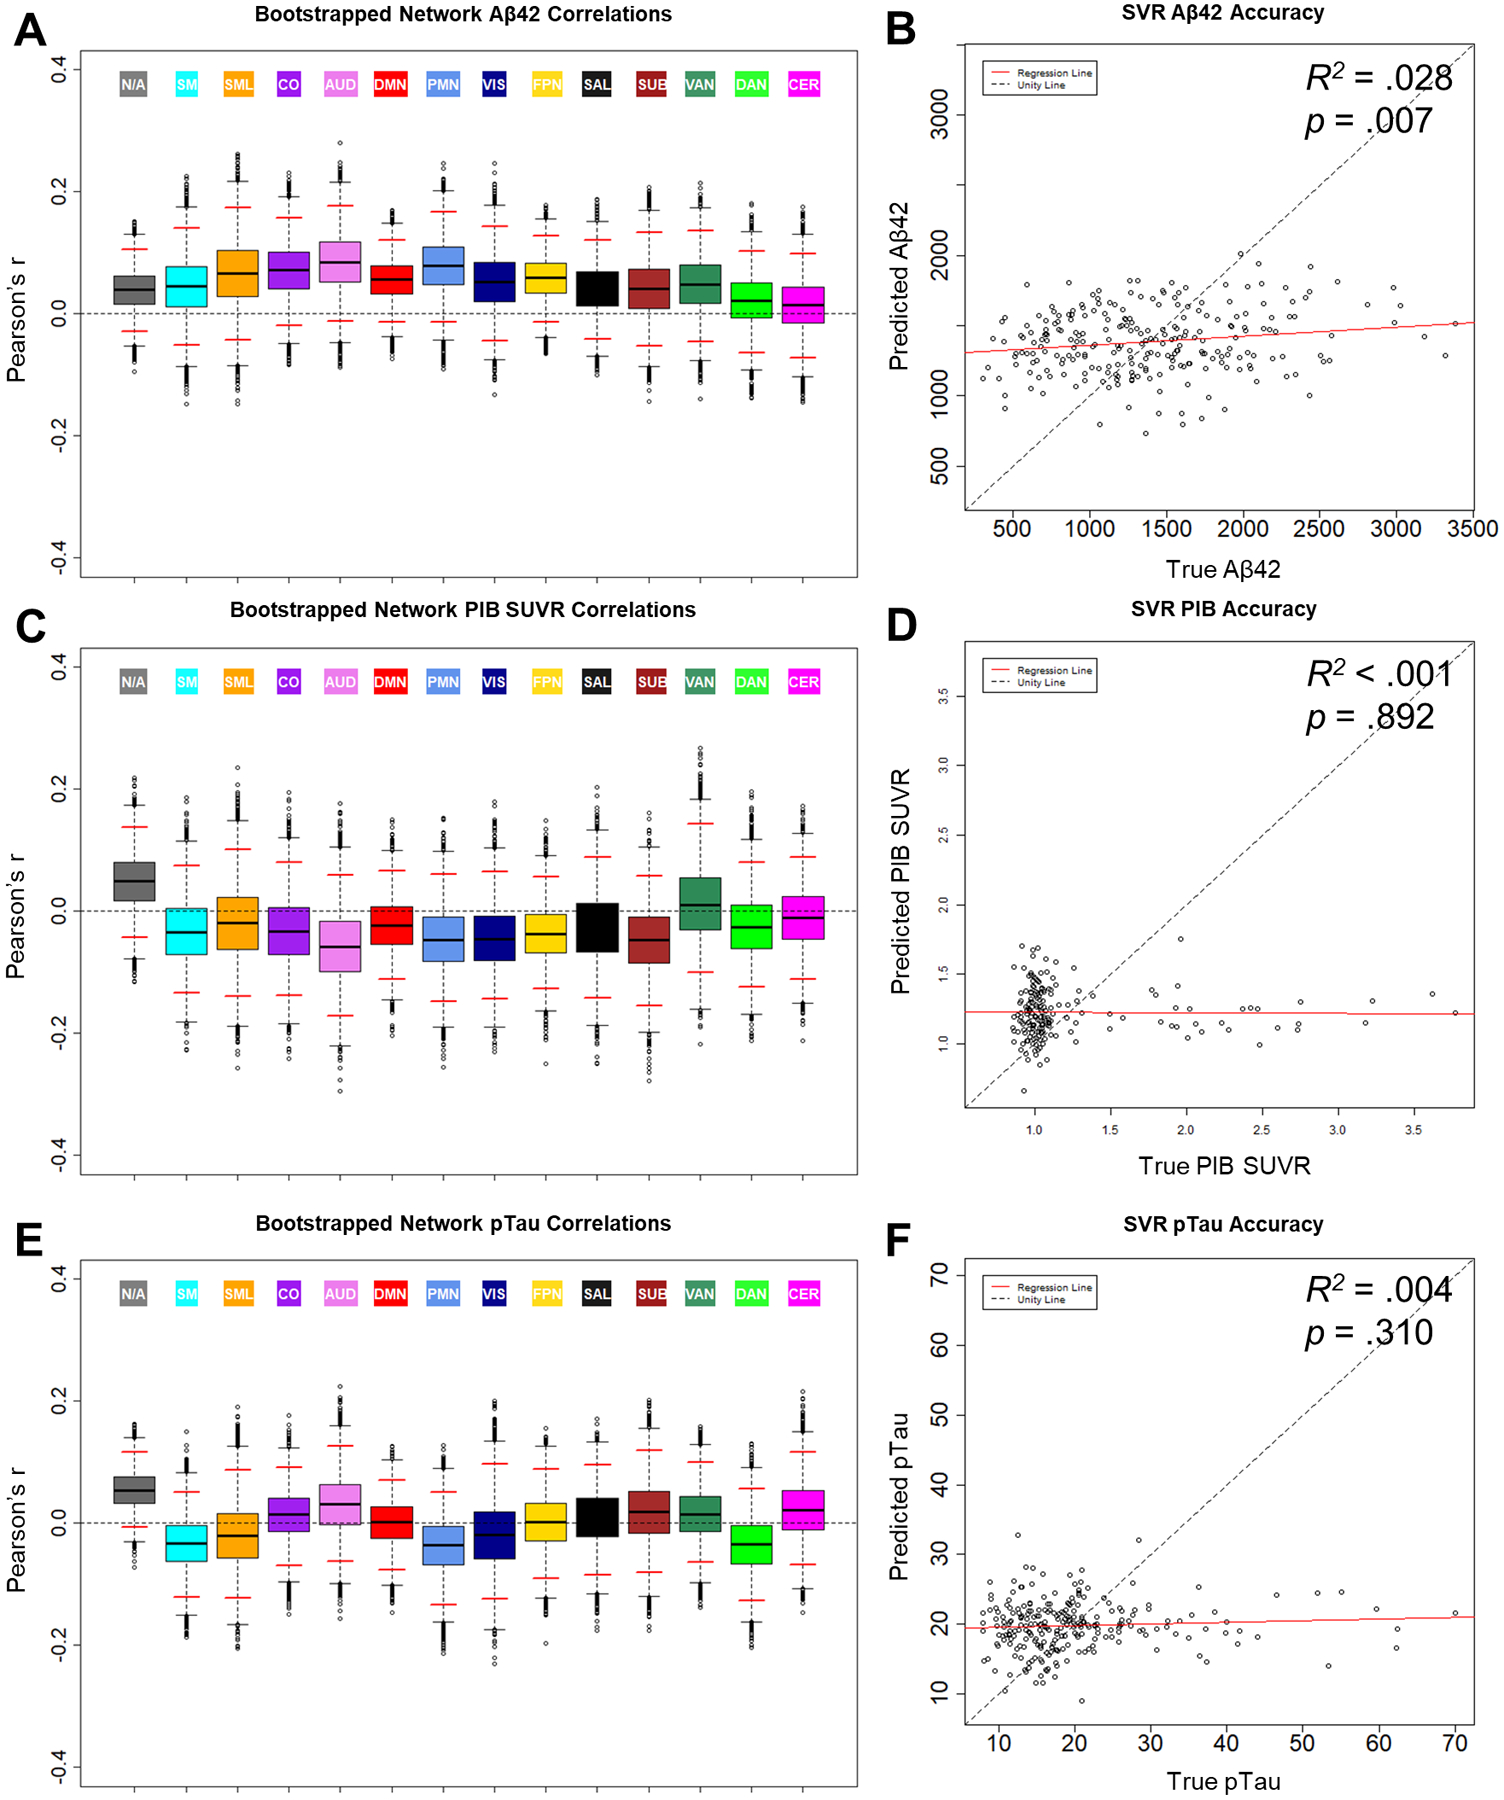
Figure 1.

Relationships between BOLD SD and biomarkers of amyloid and tau: CSF Aβ42 (A & B), PIB SUVR (C & D), and CSF pTau (E & F). Boxplots (A, C, & E) display the bootstrapped distribution of network average Pearson correlation values between BOLD SD and the biomarkers. Solid black lines denote the median of the distribution. Dotted whisker lines denote the spread of datapoints up to 1.5 times beyond the width of the IQR. Datapoints beyond the whiskers denote possible outliers. Solid red lines denote the empirical 95% confidence interval of the bootstrapped samples. Scatterplots (B, D, & F) display SVR prediction results for the biomarkers. Label values predicted by the model are plotted as a function of the true value. Aβ42 = amyloid β peptide 42, PIB = [11C]-Pittsburgh Compound B, SUVR = standard uptake ratio, pTau = phosphorylated tau-181, SVR = support vector regression
