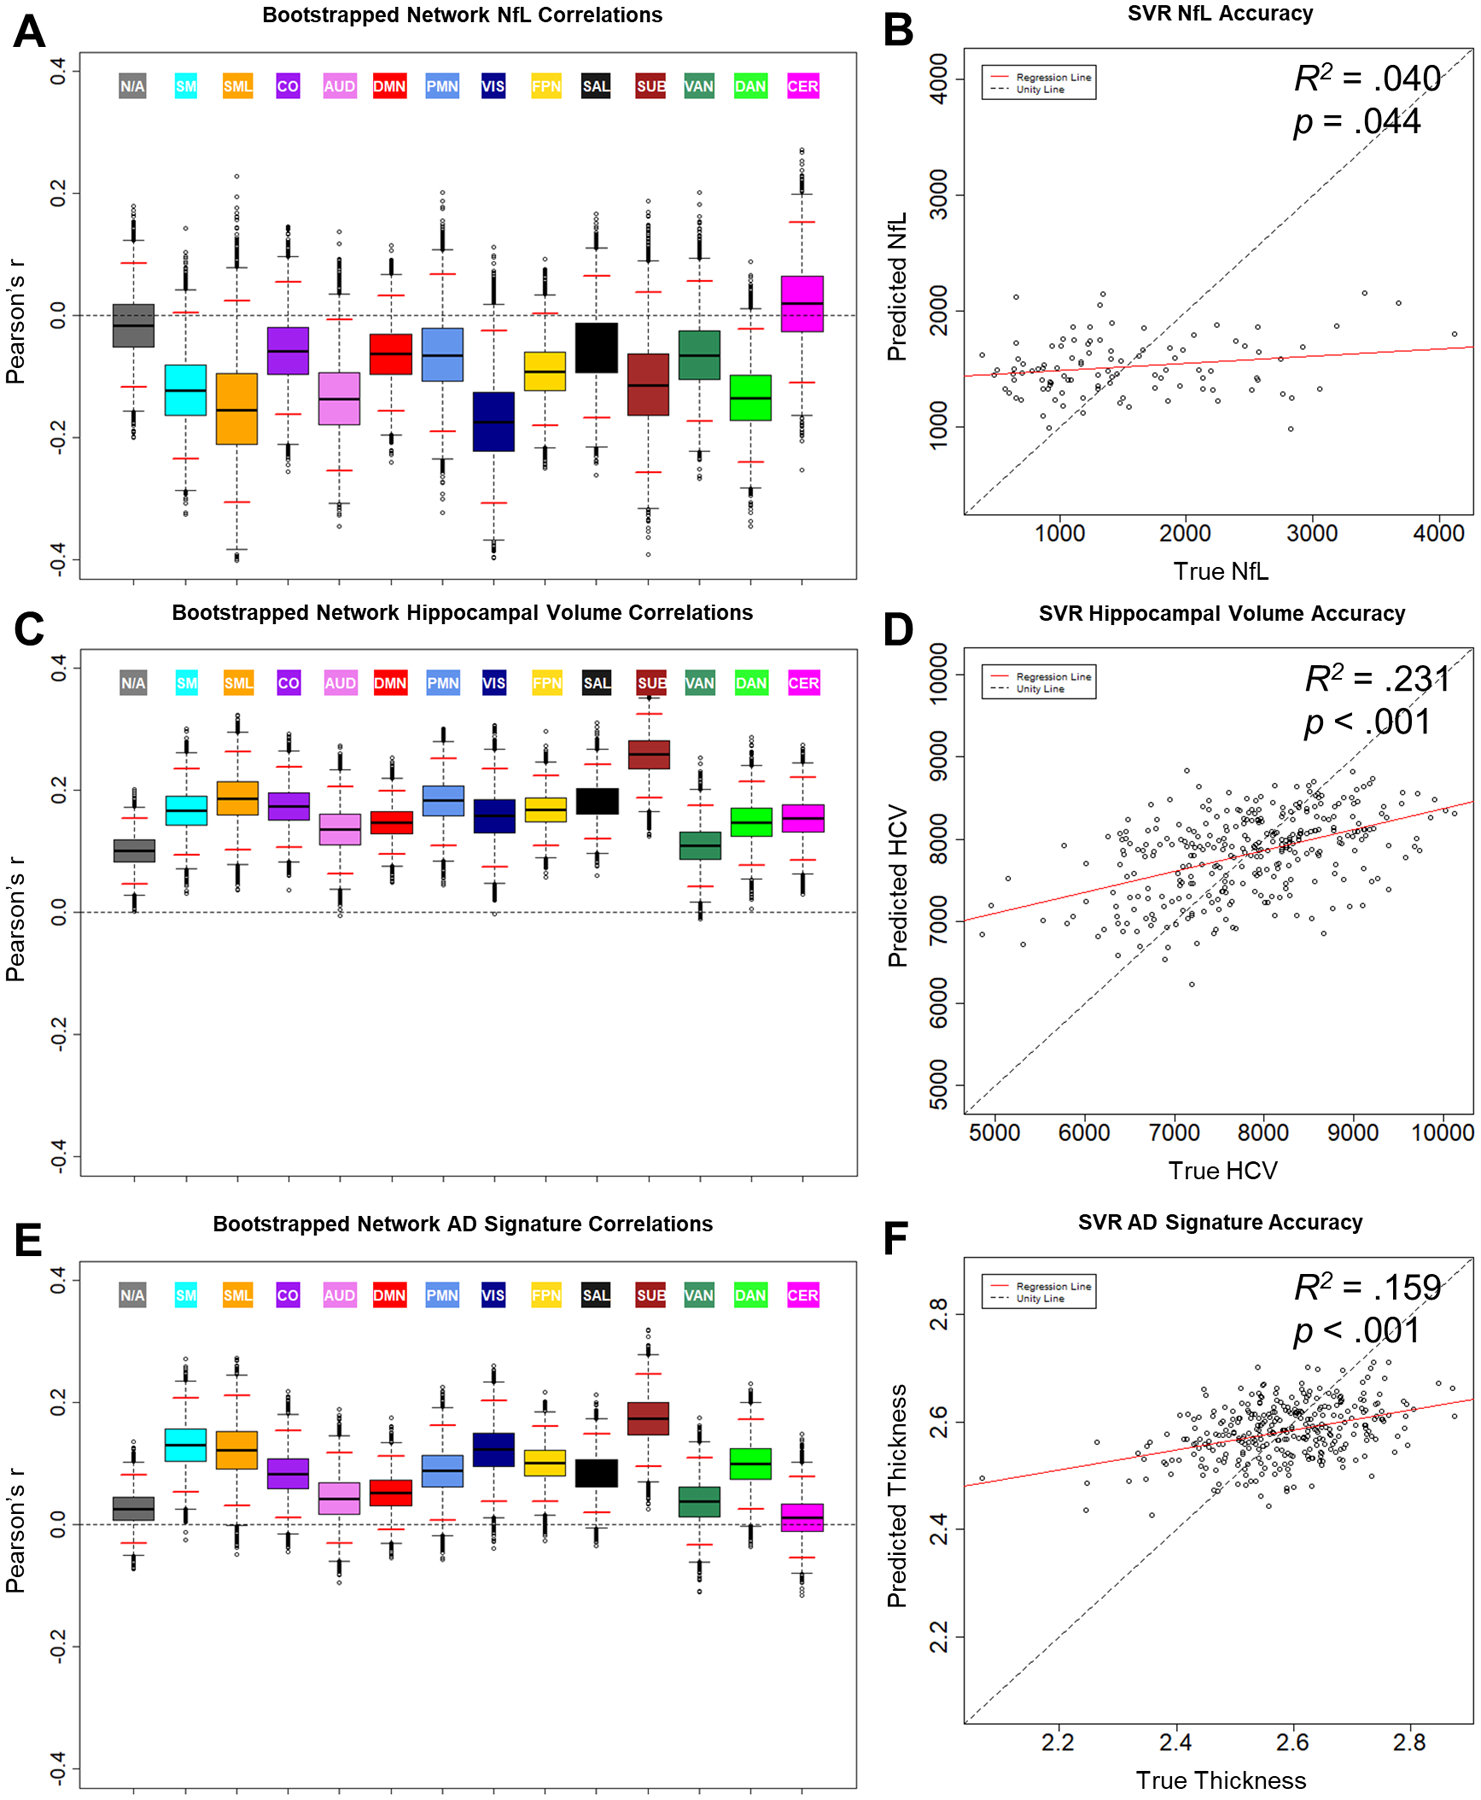
Figure 3.

Relationships between BOLD SD and biomarkers of neurodegeneration: CSF NfL (A & B), hippocampal volume (C & D), and AD signature (E & F). Boxplots (A, C, & E) display the distribution and empirical 95% confidence interval (red lines) of bootstrapped distributions of network average Pearson correlations. Scatterplots (B, D, & F) display biomarker measures predicted by SVR model as a function of true score. NfL = neurofilament light, AD signature = Alzheimer disease signature region cortical thickness composite
