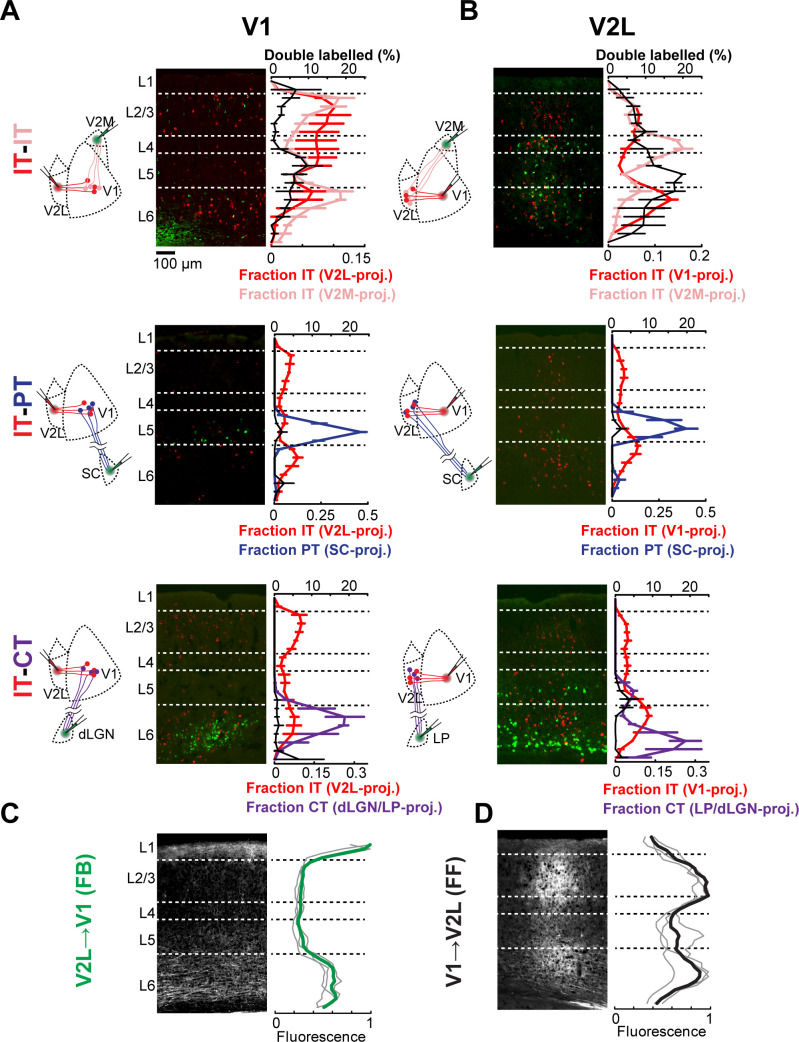
Figure 1. Cortical neurons projecting to different areas are intermingled and accessible to feedforward (FF) and feedback (FB) axons.
(A) Distribution of retrogradely labeled projection neurons in primary visual cortex (V1) after injection of a red-fluorescent tracer in lateral visual areas (V2L) and an infrared-fluorescent tracer in either medial visual areas (V2M), superior colliculus (SC), or visual thalamus. Left, experimental configuration; center, representative fluorescent histological section, with infrared fluorescence shown in green; right, colored traces show the mean laminar distribution of the different projection neurons binned in 50 μm increments, while the black trace shows the percentage of retrogradely labeled neurons that are double-labeled at each depth (n = 3 animals per group). Error bars, standard error; dashed lines, approximate layer boundaries. (B) Distribution of retrogradely labeled projection neurons in V2L after injection of a red-fluorescent tracer in V1 and an infrared-fluorescent tracer in either V2M, SC, or visual thalamus (n = 3 animals per group). (C) Distribution of anterogradely labeled V2L FB axons in V1. Left, representative fluorescent histological section; right, axonal fluorescence across cortical depth binned in 50 μm increments. Individual mice, thin gray traces; average, thick green trace (n = 3 animals). (D) Distribution of anterogradely labeled V1 FF axons in V2L (n = 3 animals).


