. 2021 Feb 1;10:e59551. doi: 10.7554/eLife.59551

Figure 2. Measuring the strength and dendritic distribution of cortico-cortical (CC) inputs to different projection neurons.

(A) We probed the strength of CC inputs to looped and non-looped neurons in different cortical layers. (B) Example experiment configuration. Retrograde tracers are injected in two areas to label different projection neurons. One cortical area is also co-injected with adeno-associated virus (AAV)-channelrhodopsin-2 (ChR2) to express ChR2 in a specific CC projection. (C) Example of subcellular channelrhodopsin-2 (ChR2)-assisted circuit mapping (sCRACM) experiment. Pairs of neighboring retrogradely labeled neurons in the same cortical layer were sequentially recorded. During each recording, a laser beam was scanned over the dendrites of the cell at different locations in a grid pattern. (D) Brightfield image of an acute coronal cortical slice showing the recording pipette and photostimulation grid. (E) Excitatory postsynaptic currents (EPSCs) recorded from a pair of neighboring L5 neurons, evoked by photostimulating ChR2+ V2L→V1 FB terminals on a grid. (F) Left, dendritic morphology staining of the recorded pair. Right, identity of the recorded projection neuron was confirmed by fluorescence in the soma of both a retrograde tracer and a different-colored dye introduced from the internal patch pipette solution. (G) sCRACM maps of the recorded pair overlaid on their reconstructed dendrites. Responsive locations are color-coded to represent mean amplitude.

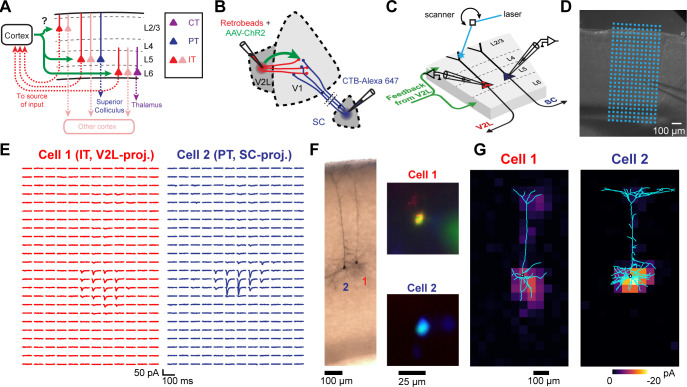
Figure 2.

Figure 2—figure supplement 1. Total input vs. laminar depth across different projections and projection neuron classes.

Figure 2—figure supplement 1.

(A) Total subcellular channelrhodopsin-2 (ChR2)-assisted circuit mapping (sCRACM) input per neuron as a function of cortical depth for both feedforward (FF) projections. Circles, individual cells. Triangles, mean values per projection class for each experiment. Averages from paired data are joined by a line. Color indicates projection class. (B) Total sCRACM input per neuron as a function of cortical depth for both feedback (FB) projections.
Figure 2—figure supplement 2. Analysis of the incidence of retrograde infection of projection neurons by adeno-associated viruses (AAVs).

Figure 2—figure supplement 2.

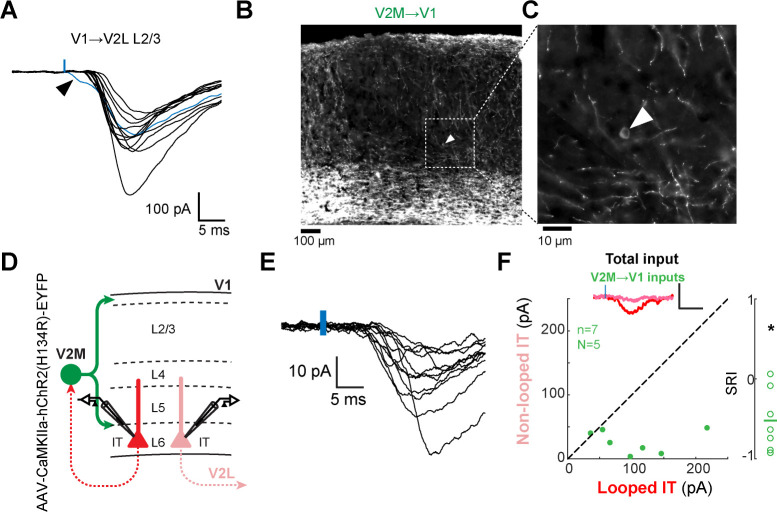
(A) Example of subcellular channelrhodopsin-2 (ChR2)-assisted circuit mapping (sCRACM) traces from individual neurons (data from L2/3 looped intratelencephalic [IT] neurons). Each trace corresponds to the average excitatory postsynaptic current (EPSC) in the location eliciting the largest amplitude. Blue tick, laser pulse. The arrowhead indicates a single neuron (trace in blue) in which the laser pulse evoked an early-onset EPSC, suggestive of a non-synaptic response. Ten neurons with early-onset EPSCs were detected in the entire dataset and removed from further analysis. (B) Anti-green fluorescent protein (GFP) immunostained section of primary visual cortex (V1) showing fluorescent medial visual area (V2M) axons in an animal injected with AAV2/1-CAG-ChR2-Venus. (C) Higher magnification image of a region in (B). The arrow indicates an example of a retrogradely infected neuron in V1. (D) Configuration of experiment comparing strength of V2M feedback (FB) input to pairs of L6 looped and non-looped IT neurons in V1 using AAV5-CaMKIIa-hChR2(H134R)-EYFP. (E) sCRACM traces from 11 looped IT neurons recorded in L6 from the experiment in (D). (F) Left, paired comparisons of total FB input to looped vs. non-looped IT neurons from the experiment in (D). Inset traces represent group averages for each projection class. Blue tick, light pulse. Right, sCRACM Response Index (SRI) of the same data. *, p=0.0116.