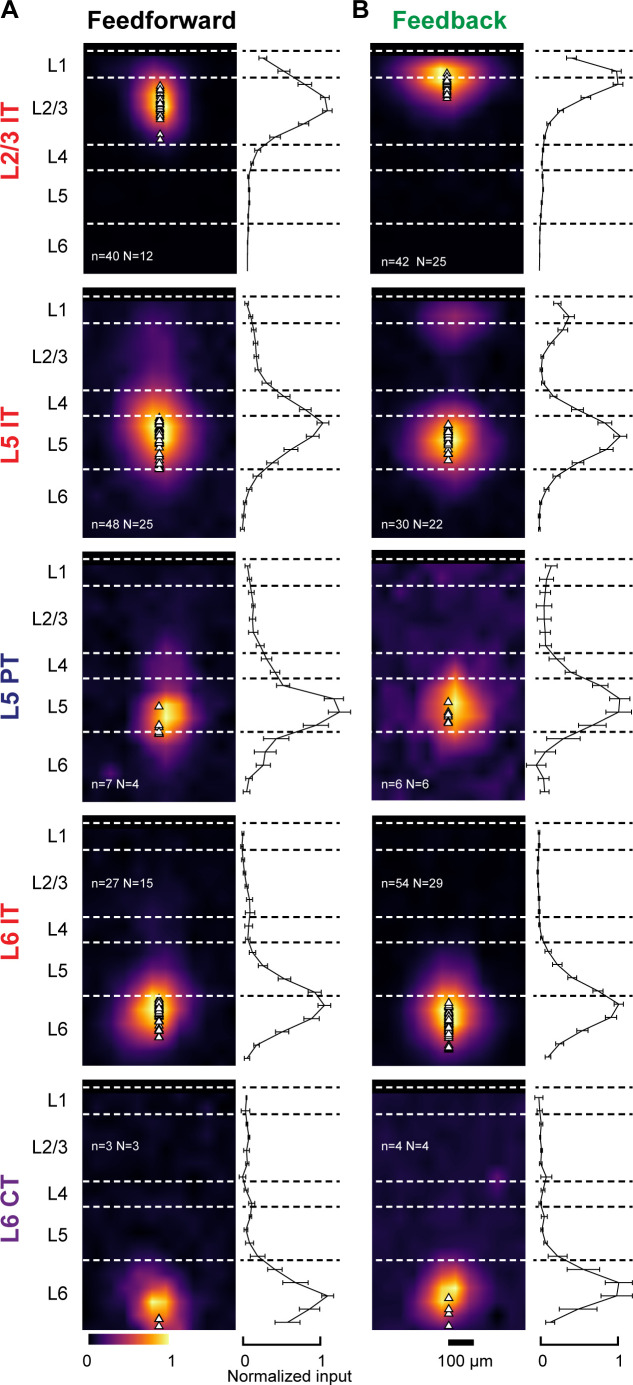
Figure 3. Dendritic distribution of feedforward (FF) and feedback (FB) inputs to different projection neuron classes.
(A) Left, group averages of subcellular channelrhodopsin-2 (ChR2)-assisted circuit mapping (sCRACM) maps aligned by pia position showing primary visual cortex (V1) FF input to the different cell types (combining V1→V2L and V1→V2M inputs in the case of intratelencephalic [IT] neurons). Triangles, soma position. Right, vertical profiles of input strength. Error bars, s.e.m.; n, number of neurons; N, number of mice. (B) Group averages and vertical profiles of sCRACM maps showing FB input to the different cell types in V1 (combining V2L→V1 and V2M→V1 inputs in the case of IT neurons).


