. 2021 Feb 1;10:e59551. doi: 10.7554/eLife.59551

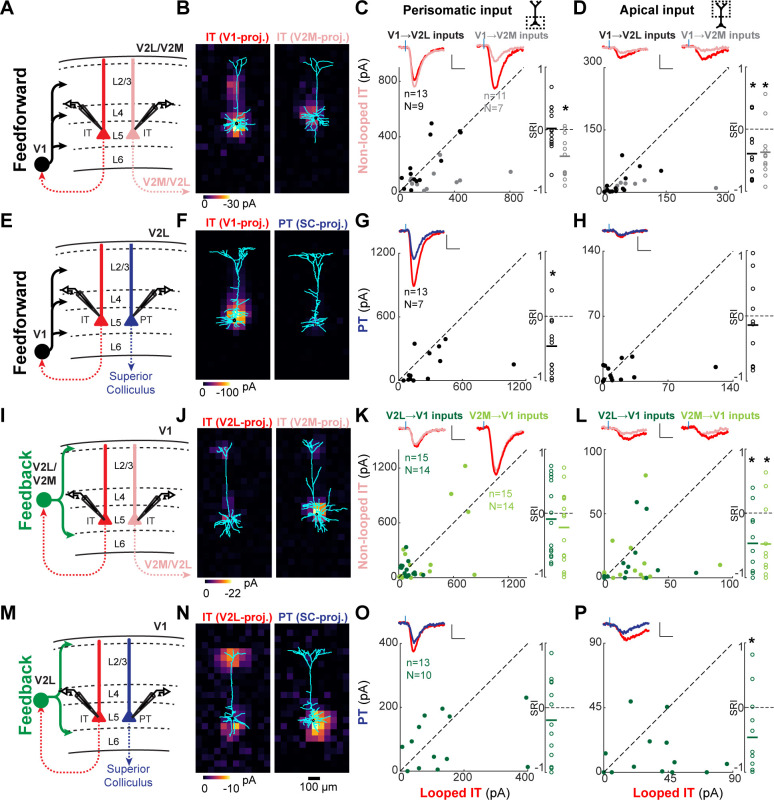
Figure 5. Feedforward (FF) and feedback (FB) inputs are stronger in looped intratelencephalic (IT) neurons than in neighboring non-looped IT or pyramidal tract (PT) neurons in L5.

(A) Configuration of experiments comparing strength of primary visual cortex (V1) FF input to pairs of L5 looped and non-looped IT neurons in lateral visual (V2L) or medial visual (V2M) areas. (B) Example pair of subcellular channelrhodopsin-2 (ChR2)-assisted circuit mapping (sCRACM) maps overlaid on reconstructed dendrites showing monosynaptic V1 FF inputs to a looped IT neuron (left) and an adjacent non-looped IT neuron (right) recorded in V2L. (C) Left, paired comparisons of perisomatic FF input to looped vs. non-looped IT neurons; black dots, V1→V2L inputs; gray dots, V1→V2M inputs. Traces were generated by averaging the mean perisomatic excitatory postsynaptic current (EPSC) of each neuron across all neurons in the same projection class. Blue tick, laser pulse. Scale bars in all panels, 2 pA and 20 ms. Right, sCRACM Response Index (SRI) of the same data. Number of cell pairs and animals are the same as in the left plot unless otherwise specified. Horizontal line, mean. *, p<0.05, see text for exact value. (D) Same as C for apical inputs (SRI: V1→V2L, n = 12, N = 8; V1→V2M, n = 11, N = 7). (E) Configuration of experiment comparing strength of V1 FF input to pairs of L5 looped IT and PT neurons in V2L. (F) Example pair of sCRACM maps overlaid on reconstructed dendrites showing monosynaptic V1 FF inputs to a looped IT neuron (left) and an adjacent PT neuron (right) recorded in V2L. (G) Paired comparisons and SRI of perisomatic FF input to looped IT vs. PT neurons. (H) Paired comparisons and SRI (n = 11, N = 7) of apical FF input to looped IT vs. PT neurons. (I) Configuration of experiments comparing strength of V2L or V2M FB input to pairs of L5 looped and non-looped IT neurons in V1. (J) Example pair of sCRACM maps overlaid on reconstructed dendrites showing monosynaptic V2L FB inputs to a looped IT neuron (left) and an adjacent non-looped IT neuron (right) recorded in V1. (K) Paired comparisons and SRI of perisomatic FB input to looped vs. non-looped IT neurons. Dark green dots, V2L→V1 inputs; light green dots, V2M→V1 inputs. (L) Paired comparisons and SRI (V2L→V1, n = 11, N = 10; V2M→V1, n = 11, N = 10) of FB input in L1 to looped vs. non-looped IT neurons. (M) Configuration of experiment comparing strength of V2L FB input to pairs of L5 looped IT and PT neurons in V1. (N) Example pair of sCRACM maps overlaid on reconstructed dendrites showing monosynaptic V2L FB inputs to a looped IT neuron (left) and an adjacent PT neuron (right) recorded in V1. (O) Paired comparisons and SRI of perisomatic FB input to looped IT vs. PT neurons. (P) Paired comparisons and SRI (n = 12, N = 9) of FB input in L1 to looped IT vs. PT neurons.

Figure 5.

Figure 5—figure supplement 1. Total subcellular channelrhodopsin-2 (ChR2)-assisted circuit mapping (sCRACM) input to L5 neurons.
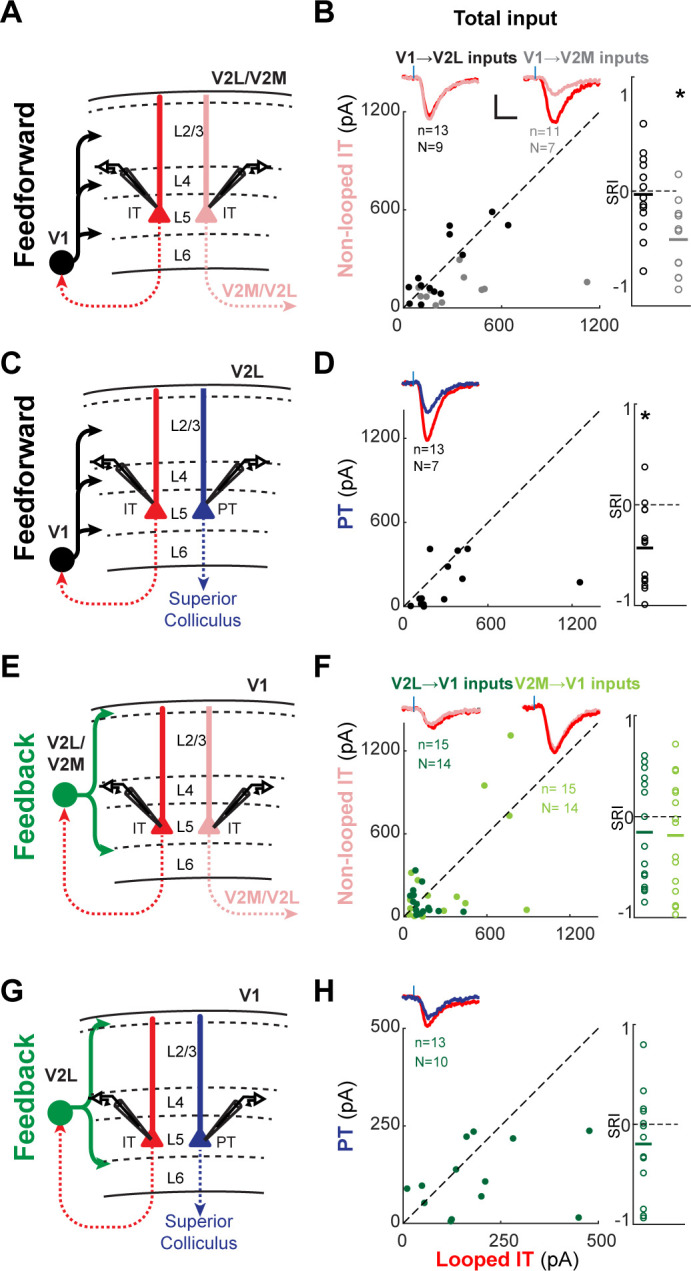
Figure 5—figure supplement 1.

(A) Configuration of experiments comparing strength of primary visual cortex (V1) feedforward (FF) input to pairs of L5 looped and non-looped intratelencephalic (IT) neurons in lateral visual areas (V2L) or medial visual areas (V2M). (B) Left, paired comparisons of total FF input to looped vs. non-looped IT neurons. Black dots, V1→V2L inputs; gray dots, V1→V2M inputs. Traces were generated by averaging the mean excitatory postsynaptic current (EPSC) of each neuron across all neurons in the same projection class. Blue tick, laser pulse. Scale bars in all panels, 2 pA and 20 ms. Right, sCRACM Response Index (SRI) of the same data. Number of cell pairs and animals are the same as in the left plot. Horizontal line, mean. *, p=0.0015. (C) Configuration of experiment comparing strength of V1 FF input to pairs of L5 looped IT and PT neurons in V2L. (D) Paired comparisons and SRI of total FF input to looped IT vs. PT neurons. *, p=0.0028. (E) Configuration of experiments comparing strength of V2L or V2M FB input to pairs of L5 looped and non-looped IT neurons in V1. (F) Paired comparisons and SRI of total FB input to looped vs. non-looped IT neurons. (G) Configuration of experiment comparing strength of V2L FB input to pairs of L5 looped IT and PT neurons in V1. (H) Paired comparisons and SRI of total FB input to looped IT vs. PT neurons.
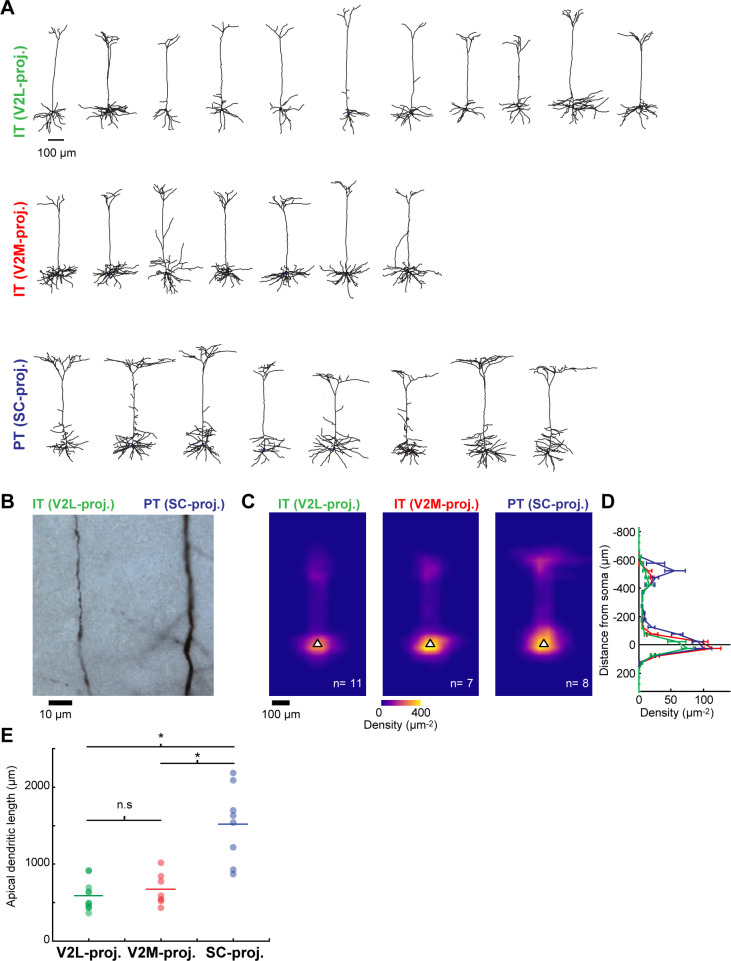
Figure 5—figure supplement 2. Dendritic morphology of the different L5 projection neuron types in primary visual cortex (V1).

Figure 5—figure supplement 2.

(A) Reconstructed dendritic morphologies of the three different L5 projection neurons recorded in V1. Top and middle, intratelencephalic (IT) neurons projecting to lateral visual (V2L) or medial visual (V2M) areas; bottom, pyramidal tract (PT) neurons projecting to superior colliculus (SC). (B) Brightfield image showing representative example of apical shaft segments from a pair of biocytin-stained IT and PT L5 neurons. The apical dendrites of SC-projecting PT neurons were of larger diameter than those of same-layer V2L- and V2M-projecting IT neurons. (C) Average normalized dendritic length density of the three cell types, aligned by soma position (white triangle). (D) Mean vertical profiles of dendritic length density (error bars, s.e.m). (E) Total apical tuft dendritic length for the three cell types. Apical tuft branches of SC-projecting PT neurons are more extensive than those of V2L- and V2M-projecting IT neurons (Kruskal-Wallis test followed by Tukey-Kramer honestly significant difference (HSD) post-hoc test, SC-projecting vs. V2L-projecting, p=0.0006; SC-projecting vs. V2M-projecting, p=0.0168; V2L-projecting vs. V2M-projecting, p=0.8044).
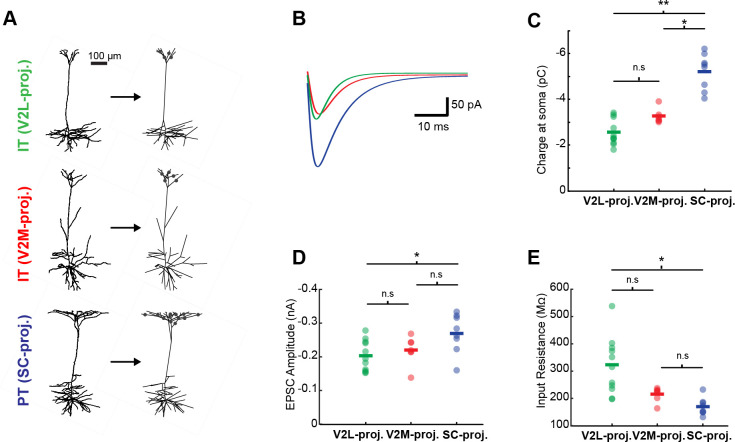
Figure 5—figure supplement 3. Simulations of the dendritic filtering of distal apical inputs.

Figure 5—figure supplement 3.

(A) Example simulations of L5 neurons. Reconstructed dendritic arbors were imported into the NEURON environment. Synapses were randomly placed with constant density along apical tuft dendritic segments. (B) Simulated excitatory postsynaptic current (EPSC) at the soma evoked by L1 input under voltage-clamp conditions for the three example neurons shown in A. (C) Mean somatic charge per cell (based on 100 simulations) resulting from apical tuft input across the three projection neuron populations. Apical inputs lacking cell-type selectivity and exhibiting equal synaptic density across the different cell types generate larger somatic currents in superior colliculus (SC)-projecting neurons vs. medial visual area (V2M)- or lateral visual area (V2L)-projecting neurons (Kruskal-Wallis test followed by Tukey-Kramer HSD post-hoc test, SC-projecting vs. V2L-projecting, p=0.0001; SC-projecting vs. V2M-projecting, p=0.0325; V2L-projecting vs. V2M-projecting, p=0.3626). (D) ESPC amplitude resulting from apical tuft input across the three projection neuron populations. EPSC amplitudes are larger in pyramidal tract (PT) neurons than in V2L-projecting neurons (Kruskal-Wallis test followed by Tukey-Kramer HSD post-hoc test, SC-projecting vs. V2L-projecting, p=0.0262; SC-projecting vs. V2M-projecting, p=0.1495; V2L-projecting vs. V2M-projecting, p=0.8753). (E) Input resistance measured from a voltage step during simulated somatic voltage-clamp in the model L5 cells. PT neurons have lower input resistance than V2L-projecting neurons (Kruskal-Wallis test followed by Tukey-Kramer HSD post-hoc test, SC-projecting vs. V2L-projecting, p=0.0003; SC-projecting vs. V2M-projecting, p=0.2082; V2L-projecting vs. V2M-projecting, p=0.1356).
Figure 5—figure supplement 4. Feedforward (FB) input to looped L5 intratelencephalic (IT) neurons vs. pyramidal tract (PT) neurons in the presence of Ih blockers.
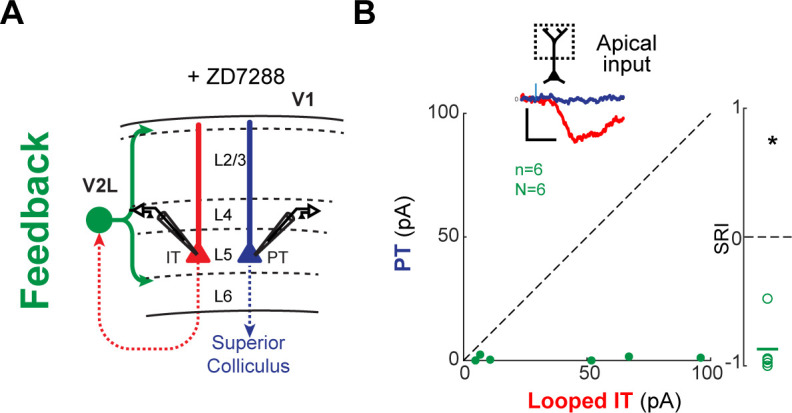
Figure 5—figure supplement 4.

(A) Configuration of experiment comparing strength of lateral visual area (V2L) feedback (FB) input to pairs of looped IT and PT neurons in primary visual cortex (V1) L5. ZD7288 was added to the bath solution to block Ih currents. (B) Left, paired comparisons of FB inputs to L1 apical dendrites of looped IT neurons vs. PT neurons in L5. Traces represent group-averaged excitatory postsynaptic currents (EPSCs) in L1. Right, sCRACM Response Index (SRI) of the same data (n = 5, N = 5). *, p=0.0009.