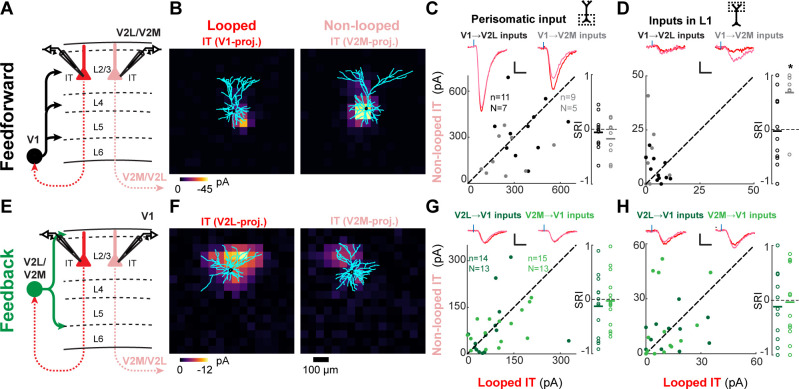
Figure 6. Feedforward (FF) and feedback (FB) connections are similar or weaker in looped L2/3 neurons.
(A) Configuration of experiments comparing strength of primary visual cortex (V1) FF input to pairs of L2/3 looped and non-looped intratelencephalic (IT) neurons in lateral visual area (V2L) or medial visual area (V2M). (B) Example pair of subcellular channelrhodopsin-2 (ChR2)-assisted circuit mapping (sCRACM) maps overlaid on reconstructed dendrites showing monosynaptic V1 FF inputs to a looped IT neuron (left) and an adjacent non-looped IT neuron (right) recorded in V2L. (C) Left, paired comparisons of perisomatic FF input to looped vs. non-looped IT neurons; black dots, V1→V2L inputs; gray dots, V1→V2M inputs. Traces were generated by averaging the mean perisomatic excitatory postsynaptic current (EPSC) of each neuron across all neurons in the same projection class. Blue tick, laser pulse. Scale bars in all panels, 2 pA and 20 ms. Right, sCRACM Response Index (SRI) of the same data. Number of cell pairs and animals are the same as in the left plot unless otherwise specified. Horizontal line, mean. *, p<0.05, see text for exact value. (D) Same as C for inputs in L1 (SRI: V1→V2L, n = 11, N = 7; V1→V2M, n = 7, N = 5). (E) Configuration of experiments comparing strength of V2L or V2M FB input to pairs of L2/3 looped and non-looped IT neurons in V1. (F) Example pair of sCRACM maps overlaid on reconstructed dendrites showing monosynaptic V2L FB inputs to a looped IT neuron (left) and an adjacent non-looped IT neuron (right) recorded in V1. (G) Paired comparisons and SRI of perisomatic FB input to looped vs. non-looped IT neurons. Dark green dots, V2L→V1 inputs; light green dots, V2M→V1 inputs. (H) Same as G for inputs in L1 (SRI: V2L→V1, n = 11, N = 10; V2M→V1, n = 12, N = 11).
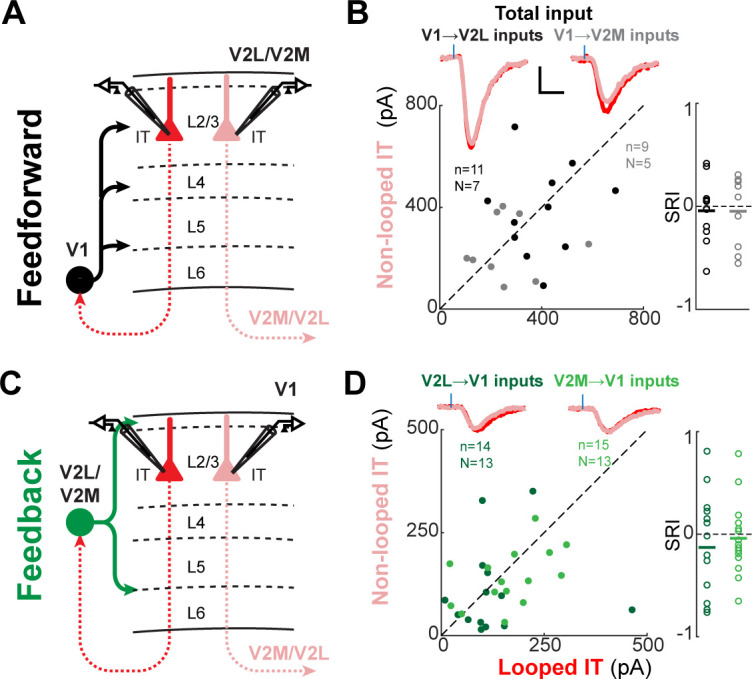
Figure 6—figure supplement 1. Total subcellular channelrhodopsin-2 (ChR2)-assisted circuit mapping (sCRACM) input to L2/3 neurons.


