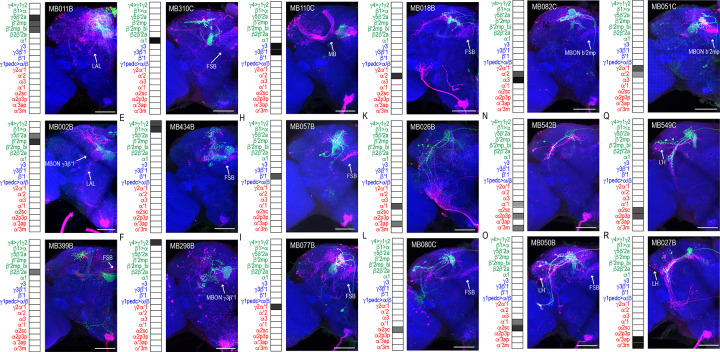
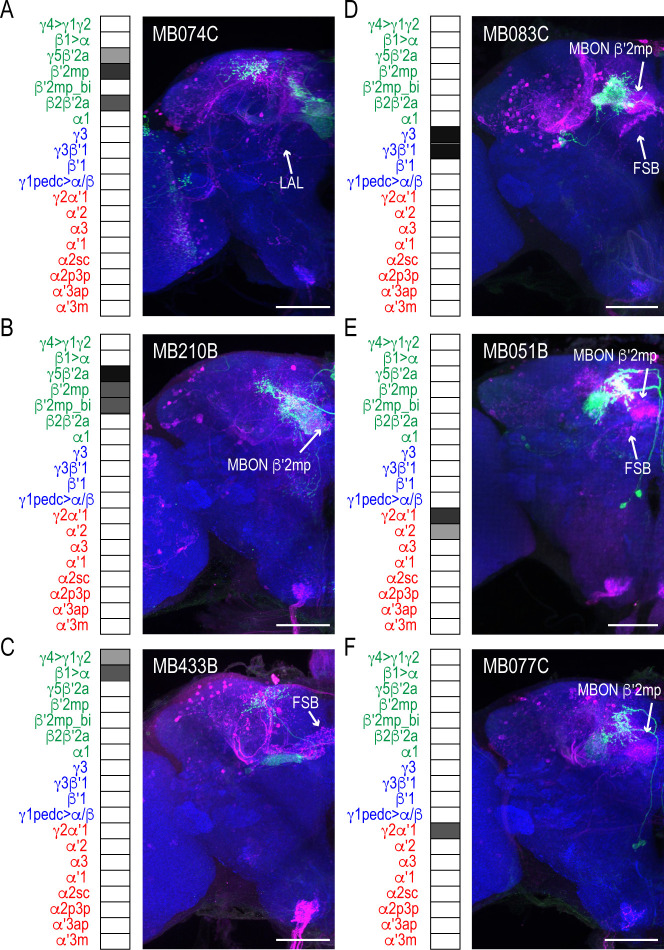
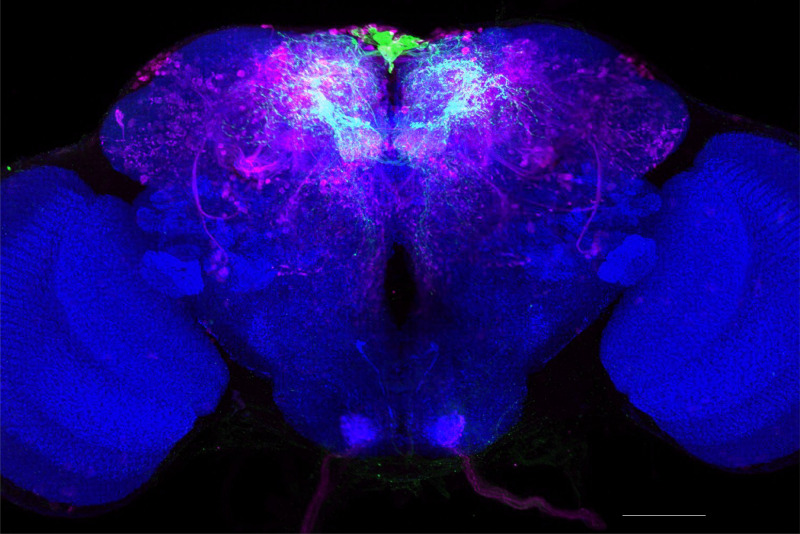
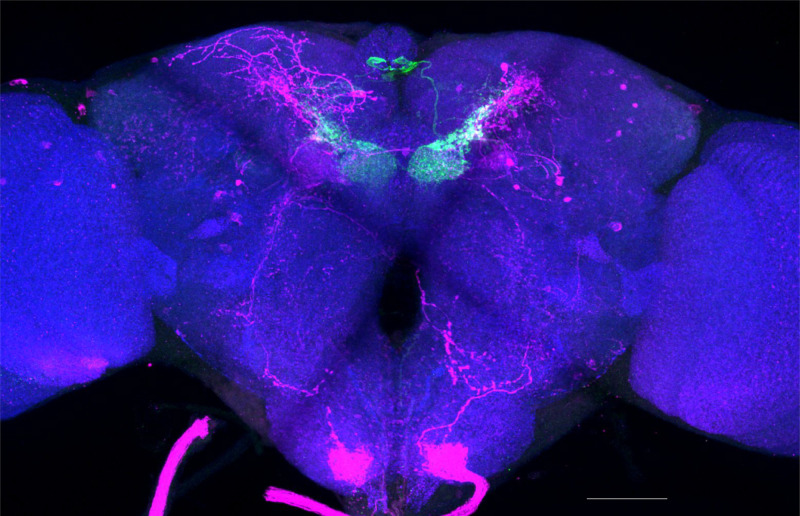
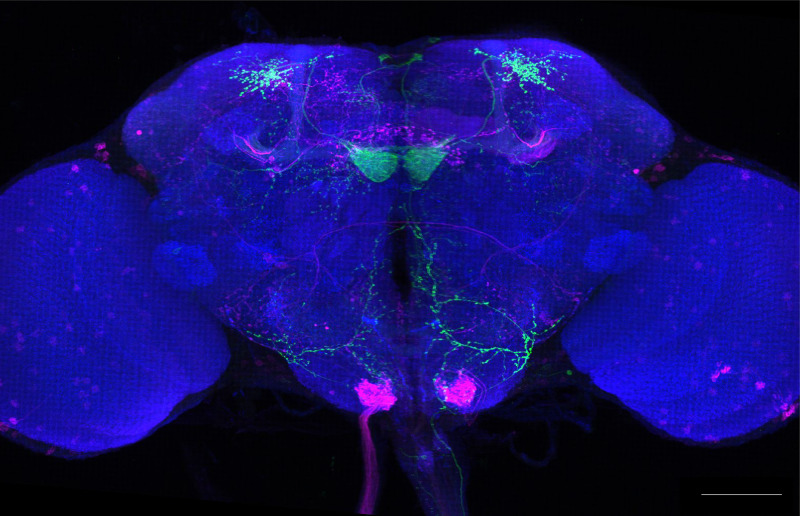
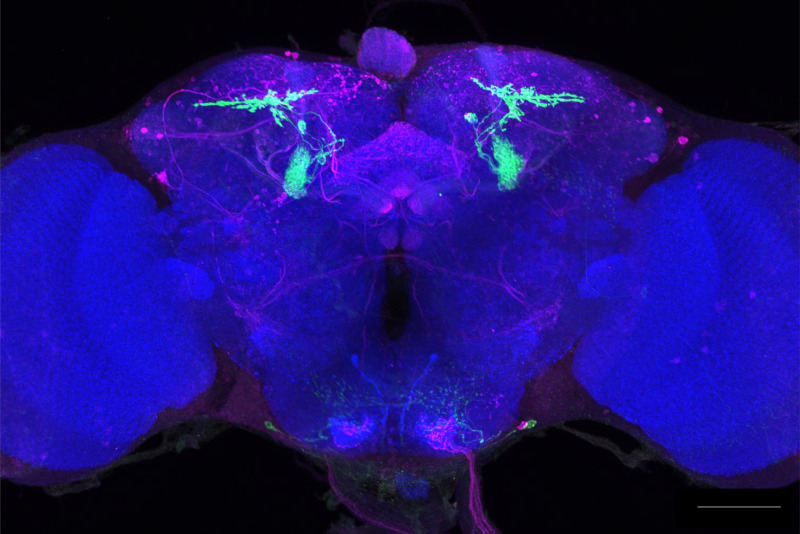
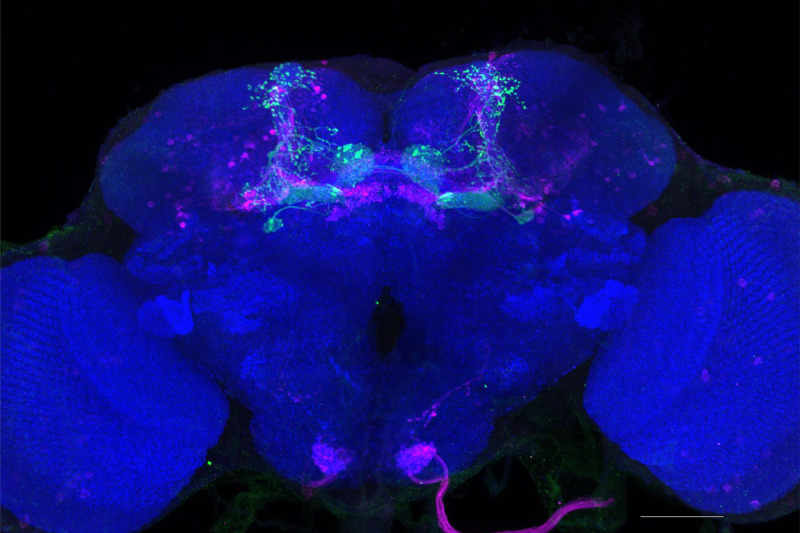
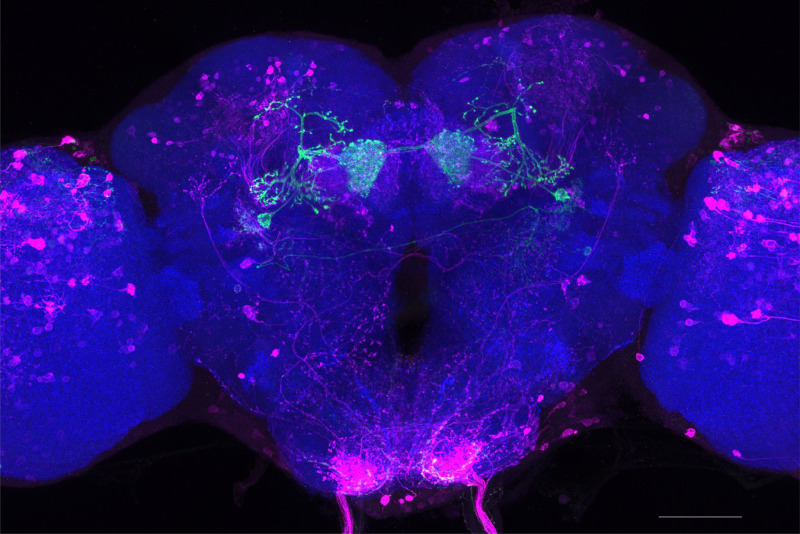
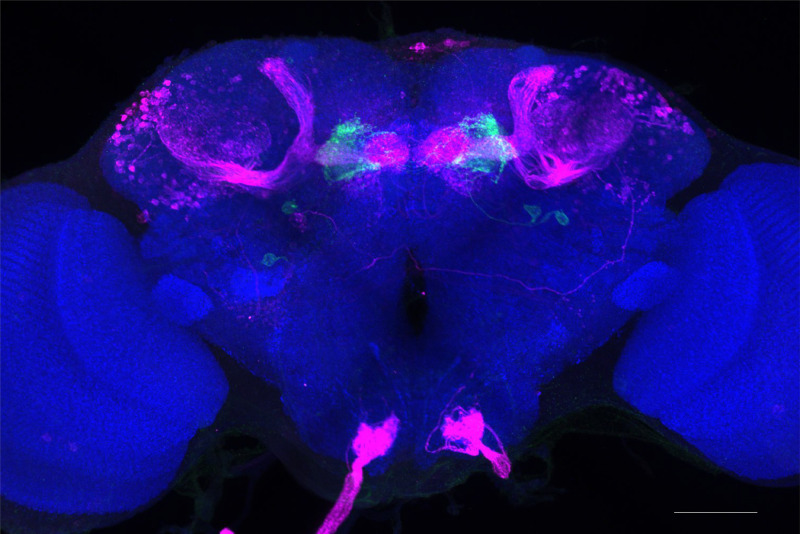
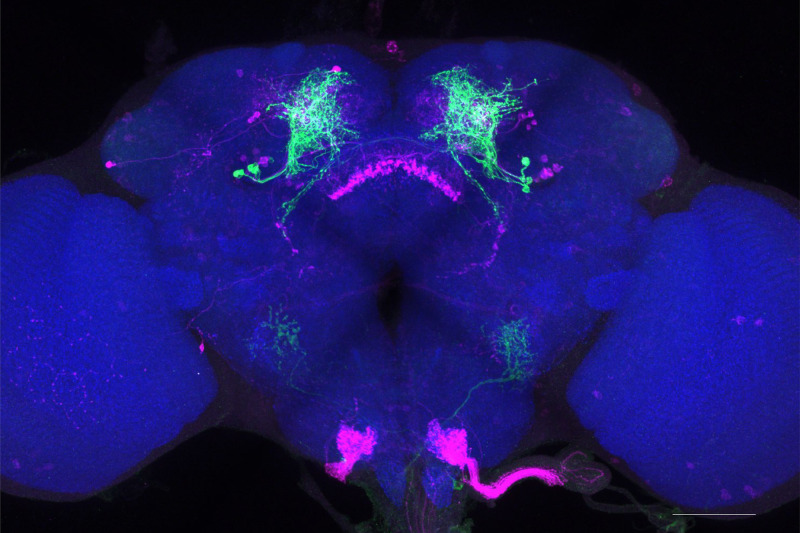
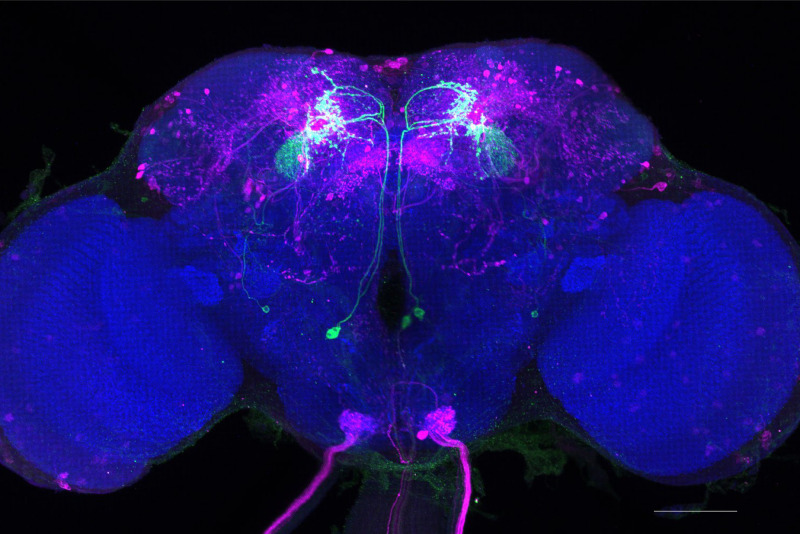
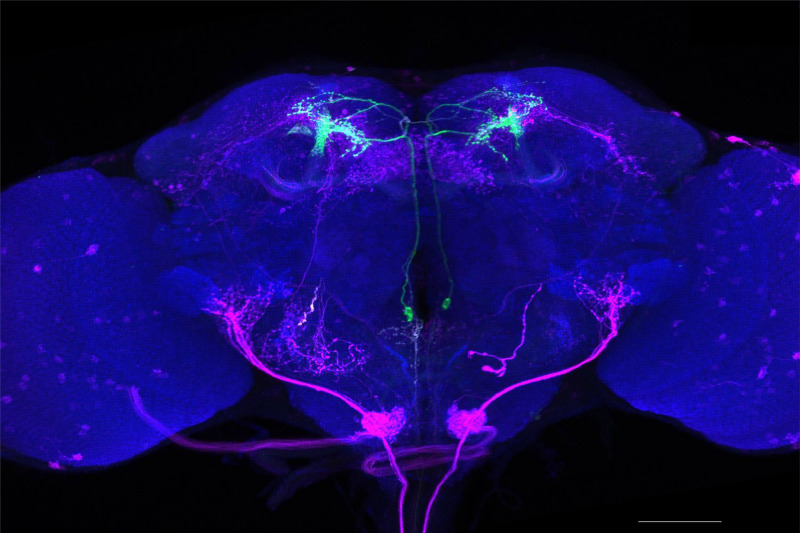
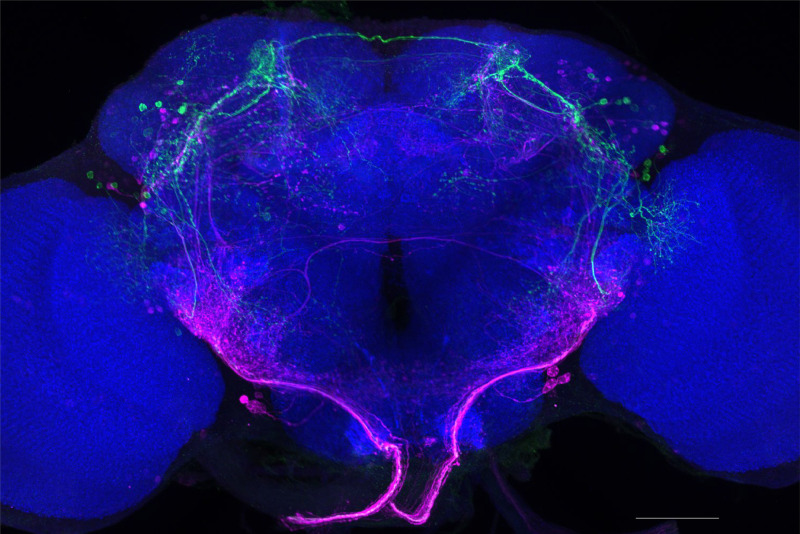
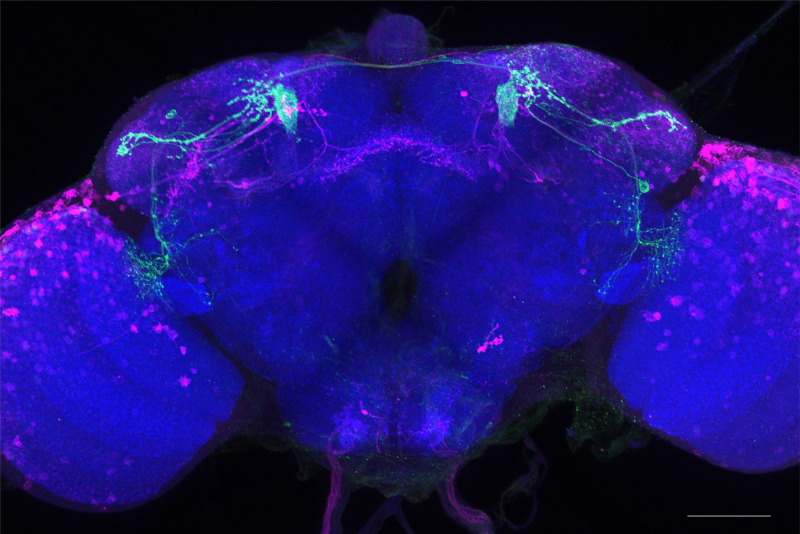
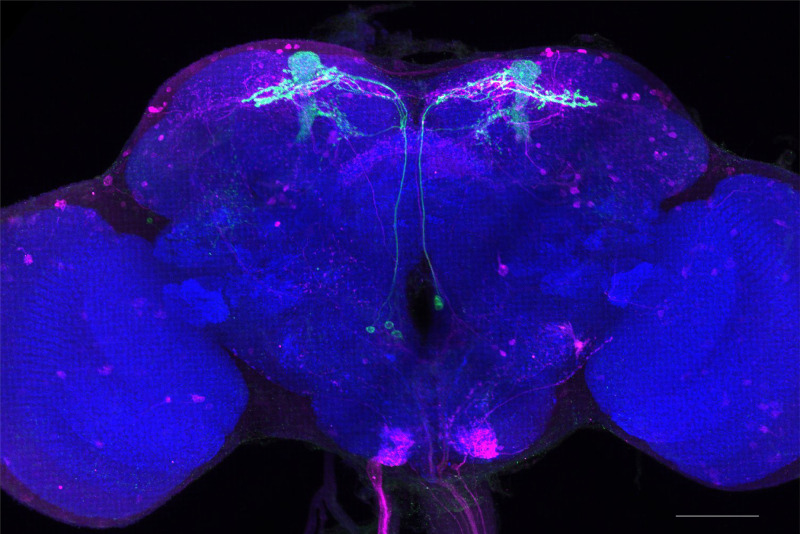
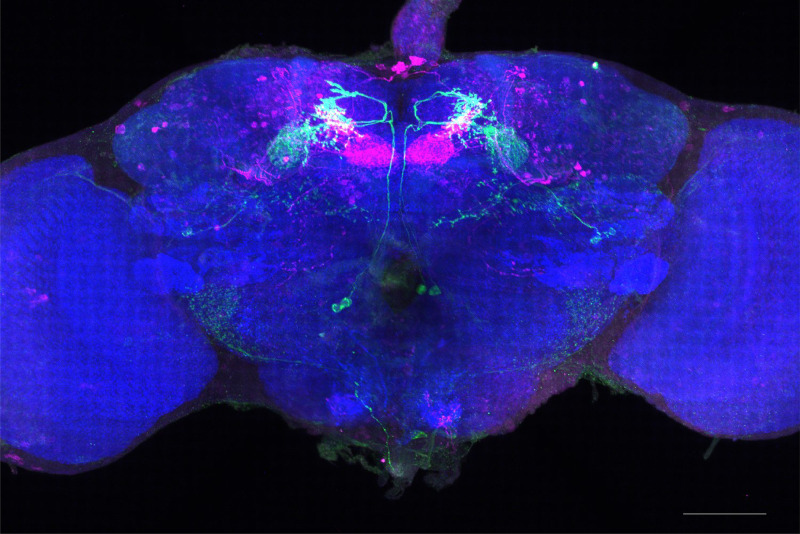
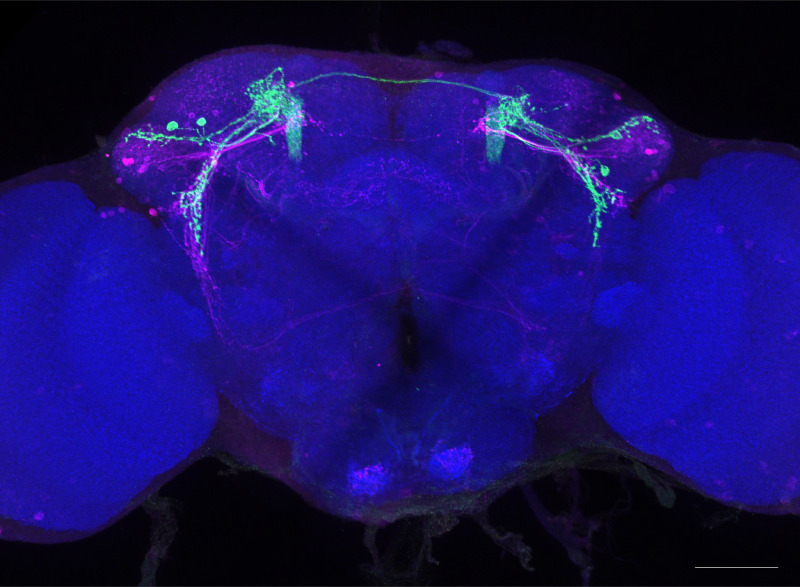
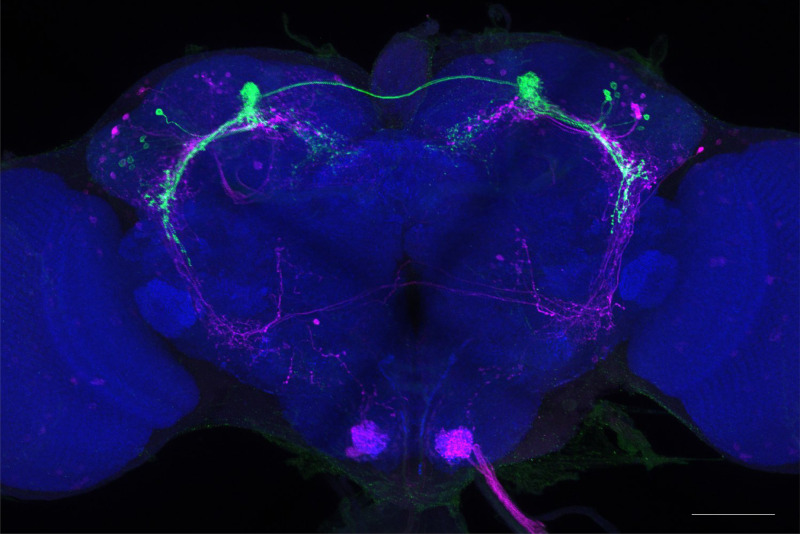
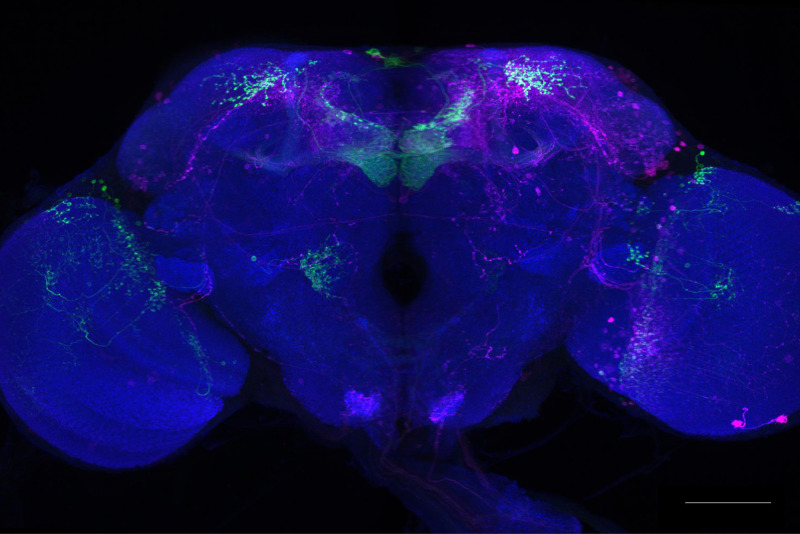
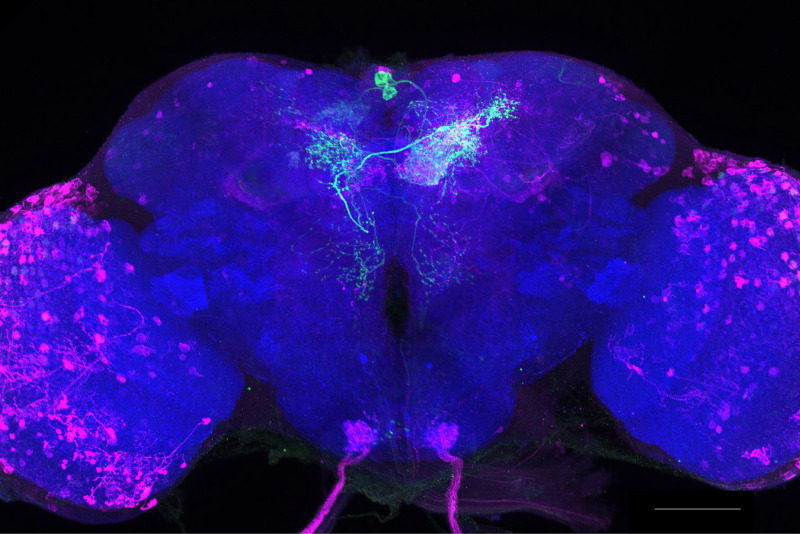
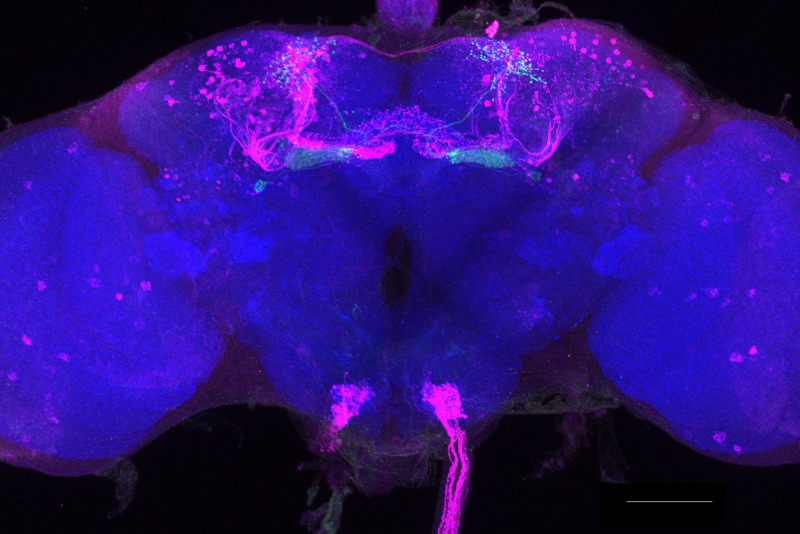
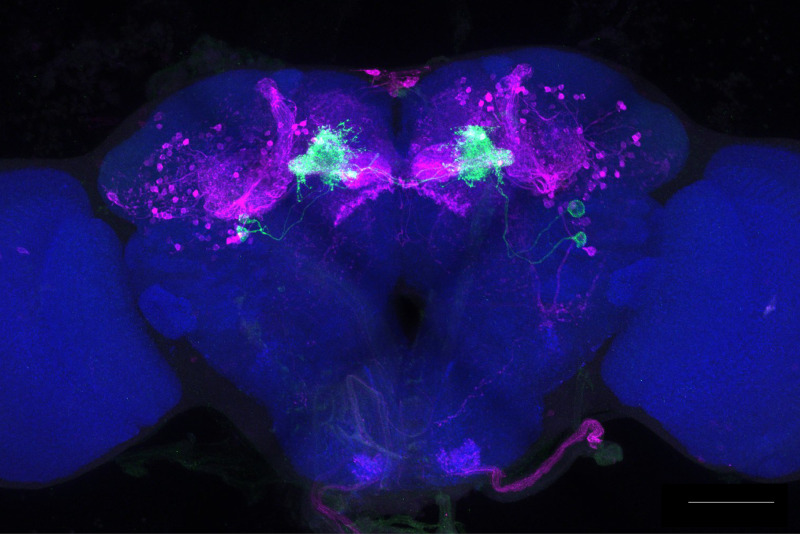
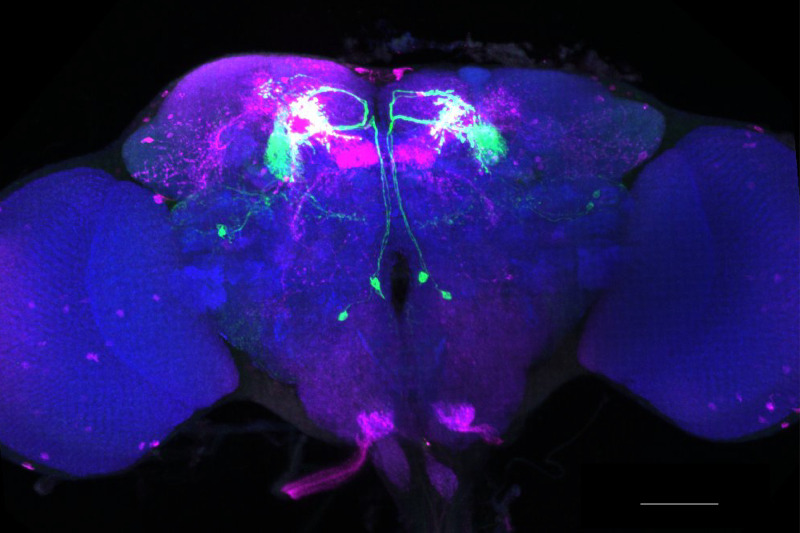
Figure 1. MBONs have divergent connections across the brain.
Exemplar max-stacks of glutamatergic MBONs (A) MB011B, (B) MB002B, (C) MB399B, (D) MB310C, (E) MB434B, (F) MB298B, GABAergic MBONs (G) MB110C and (H) MB057B, and cholinergic MBONs (I) MB077B, (J) MB018B, (K) MB026B, (L) MB080C, (M) MB082C, (N) MB542B, (O) MB050B, (P) MB051C, (Q) MB549C and (R) MB027B, trans-Tango identified postsynaptic connections. For max-stacks: green, presynaptic MBONs, magenta, postsynaptic trans-Tango signal, blue, brp-SNAP neuropil. A map of the MBONs that are included in the expression pattern in each driver line accompanies each exemplar with the relative expression pattern (grayscale, 1–5) accordingly to FlyLight (https://splitgal4.janelia.org/cgi-bin/splitgal4.cgi). MBON maps are organized by neurotransmitter type: green=glutamatergic, blue=GABAergic, red=cholinergic. Scale bar = 50 μm.

