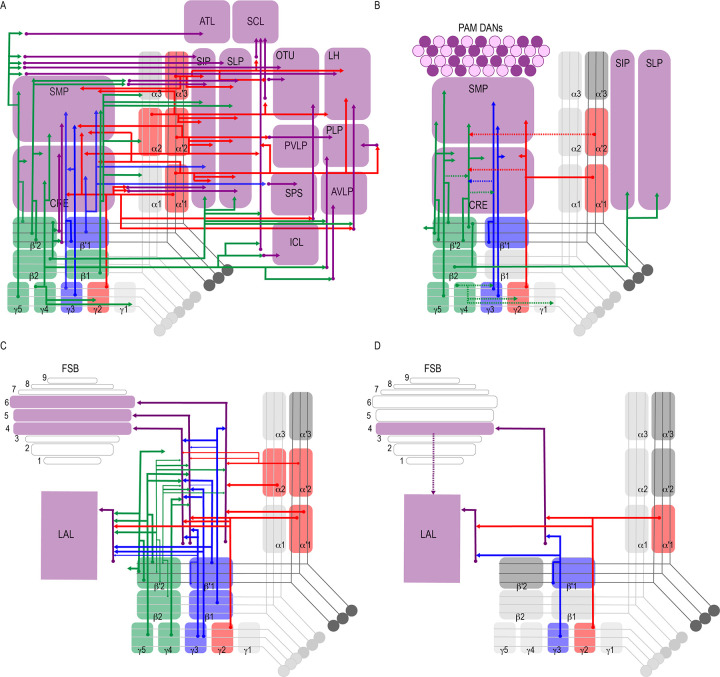
Figure 8. Summary schematics highlighting postsynaptic connections of MBON innervating (A) innervating the protocerebrum (B) PAM DANs (solid lines) and MBONs (dotted lines).
(C) FSB and LAL. Lines thickness corresponds to the percentage of trans-Tango-positive signal in FSB and LAL across brains for each MBON. (D) Schematic highlighting convergence of MBONs γ3β′1 and γ2α′1 onto the same genetically identified subsets of LAL and FSB neurons (solid lines). Dotted lines depict the established connections between the FSB and LAL (Wolff and Strausfeld, 2015b).

