. 2021 Jan 28;10:e60710. doi: 10.7554/eLife.60710

Figure 1. Stress fiber architecture of migrating cells.

3D-structured illumination microscopy (SIM) maximum intensity projections (MIPs) of the actomyosin networks in cells migrating on fibronectin. (A) Human osteosarcoma (U2OS) and mouse embryonic fibroblast (MEF) cells, where the panels on the left display complete MIPs. The panels in the middle show only the filament structures close to the ventral plane (‘ventral MIP’), and the panels on the right are magnifications of the boxed regions from the middle panels. Red arrows highlight ventral stress fibers, and white arrows indicate examples of thin cortical stress fibers that are embedded at the cell cortex. DAPI (blue) and phalloidin (gray) were applied to mark the F-actin and nucleus, respectively. Vinculin (magenta) and non-muscle myosin II (NMII)A tails (green) were detected with respective specific antibodies. (B) 3D-SIM MIP projection from the ventral plane of a U2OS cell transfected with mApple-NMIIA construct (motor, green) and stained with NMIIA-tail specific antibody (magenta, tail) and phalloidin to visualize F-actin. 4× and 10× magnifications (orange box and yellow dotted box, respectively) show the bipolar NMIIA filaments in cortical stress fibers. (C) Traction force microscopy (TFM) analysis of the forces exerted by ventral stress fibers (red arrows) and cortical stress fibers (white arrows) to the underlying substrate. On the left, exemplary image of a LifeAct-mKate1.31-expressing U2OS cell and the obtained force map with root mean square tractions (RMS). Quantification of the RMS forces between the two stress fiber subtypes (n = 41 for ventral stress fibers [SF] and 45 for cortical stress fibers) is shown on right as half-violin plot including binned individual data points and mean with ±1 standard deviation (SD). p = 1.56 × 10−12 (Mann–Whitney U-test, including outliers). Scale bars 10 µm and 5 µm for whole cell images and magnifications, respectively.

Figure 1—source data 1. Combined data of RMS traction forces.

Figure 1.

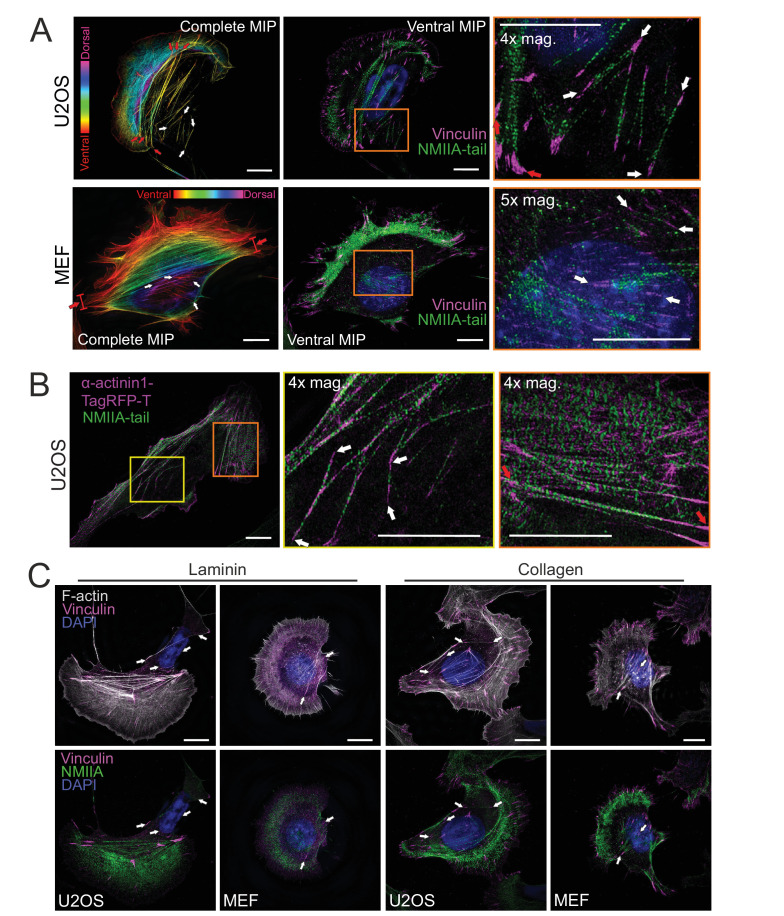
Figure 1—figure supplement 1. Cortical stress fibers display periodic non-muscle myosin II (NMII) — α-actinin pattern and assemble on different ECMs.

Figure 1—figure supplement 1.

(A) Human osteosarcoma (U2OS) and mouse embryonic fibroblast (MEF) cells (related to Figure 1A), where vinculin and NMII were detected by specific antibodies, and F-actin and nucleus by fluorescent phalloidin and DAPI, respectively. Two panels on the left show temporal color-coded projection from the phalloidin staining, where red and white arrows highlight ventral stress fibers and cortical stress fibers, respectively. At the middle, ventral plane of the cells show the localizations of vinculin and NMIIA tail. On the right, magnification of the boxed regions form the middle panels demonstrating the presence of thin cortical stress fibers (white arrows) at the back of the cell and in the vicinity of the nucleus. (B) α-actinin-1 and NMIIA localization in ventral stress fibers and cortical stress fibers in a U2OS cell. 3D-structured illumination microscopy (SIM) maximum intensity projection (MIP) with 4× magnifications of ventral stress fibers (orange box) display the periodic localization of the α−actinin1-TagRFP-T and NMIIA in the ventral stress fibers (red arrows), whereas cortical stress fibers (4× mag., yellow box) display less regular pattern of α-actinin. (C) 3D-SIM MIPs of U2OS and MEF cells cultured either on laminin or collagen coated dishes. F-actin was visualized by fluorescent phalloidin, focal adhesions by vinculin antibody, and nuclei by DAPI. Endogenous NMIIA tail domain was visualized by specific antibody. White arrows indicate examples of cortical stress fibers. Scale bars 10 µm and 5 µm for whole cell images and magnified areas, respectively.
Figure 1—figure supplement 2. Cortical stress fibers are not linked to fibrillar adhesions.

Figure 1—figure supplement 2.

(A) 3D-structured illumination microscopy (SIM) maximum intensity projections (MIPs) of human osteosarcoma (U2OS) cells and mouse embryonic fibroblasts (MEFs) cultured on uncoated high precision glass coverslips. An antibody detecting fibronectin was applied to visualize fibronectin deposits under the cells. 4× magnifications on the right (from yellow boxes) display cortical stress fibers (white arrows) in both cell types and demonstrate that in U2OS cells they do not co-localize with the fibronectin. For MEFs, some cortical stress fibers were associated with the fibronectin deposits (red asterisks). Nuclei were detected by DAPI. (B) An antibody detecting the Y118-phosphorylated version of the paxillin was applied to discern the focal adhesions from fibrillar adhesions, which were reported to be devoid of paxillin phosphorylation (Zaidel-Bar et al., 2007). 3D-SIM MIPs from both U2OS and MEF cells on fibronectin-coated high precision coverslips were stained with phalloidin (F-actin) and an antibody to detect vinculin. 4× magnification of marked areas (yellow boxes) illustrate pY118-paxillin co-localization with vinculin at the focal adhesions in the ends of cortical stress fibers (white arrows). Scale bars 10 μm and 5 μm for the whole cell images and magnified images, respectively.