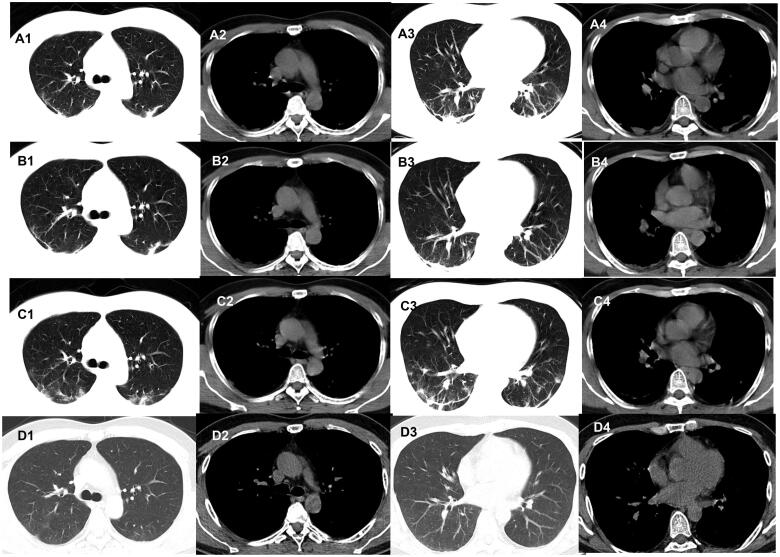
Figure 4.
Evolution of the fibrous stripes on chest CT of patients with COVID-19. A 42-year-old man who had close contact with individuals in Wuhan presentedwith fever for 1 day. (A1–A4) The first non-contrast-enhanced chest CT reveals multiple fibrous stripes in the left and right lower lobes (initial chest CT). (B1–B4)Follow-up chest CT 4 days after the first shows that both the scope and density of the lesions decrease (stage I*). (C1–C4) Follow-up chest CT 8 days after the first shows that both the scope and density of the lesions decrease further (stage II*). (D1–D4) Follow-up chest CT 12 days after the first shows that the lesions are almost absorbed completely (stage III*). *The stage does not represent the course of COVID-19 but the time interval between the two adjacent CT scans.

