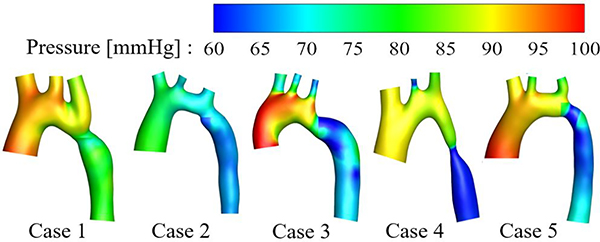
Fig. 2.
Pressure distributions in five aortas with coarctation. Since the peak pressure occurs at different times in AAo and DAo, the pressure distributions of the areas proximal and distal to the coarctation were individually extracted at their respective peak times and juxtaposed for visualization.

