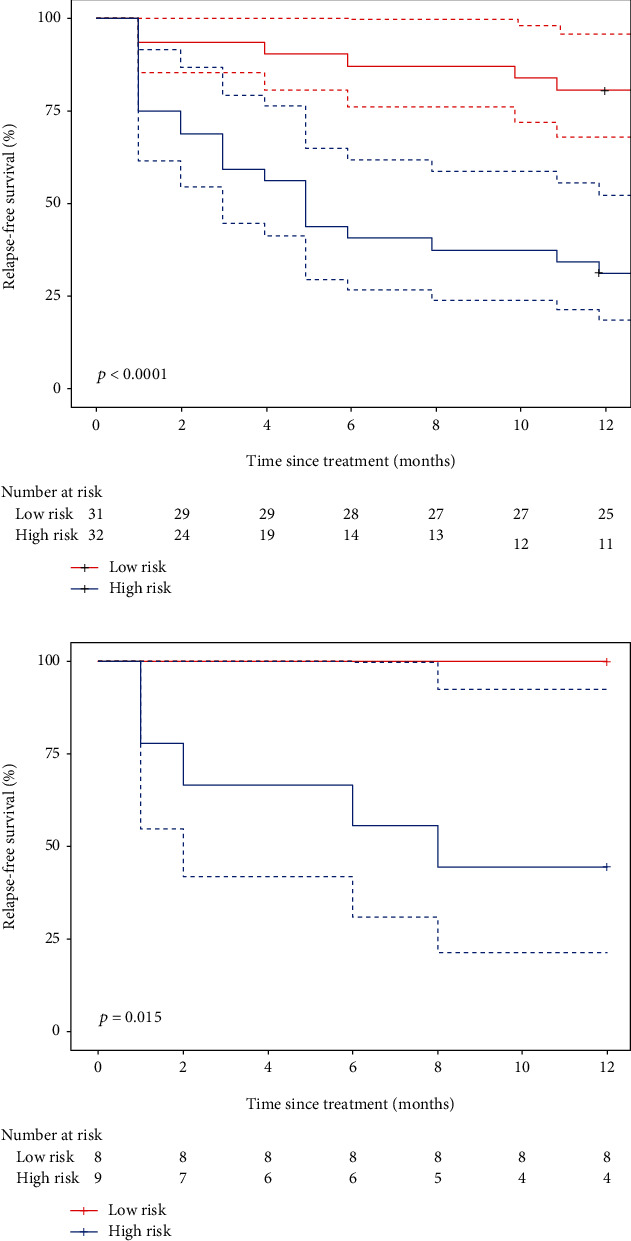
Figure 4.

Kaplan-Meier survival curves according to the radiomics signature for patients with OS in (a) training cohort and (b) validation cohort. Dashed lines are two-sided CI of the survival curves (solid line).

Kaplan-Meier survival curves according to the radiomics signature for patients with OS in (a) training cohort and (b) validation cohort. Dashed lines are two-sided CI of the survival curves (solid line).