Figure 6.

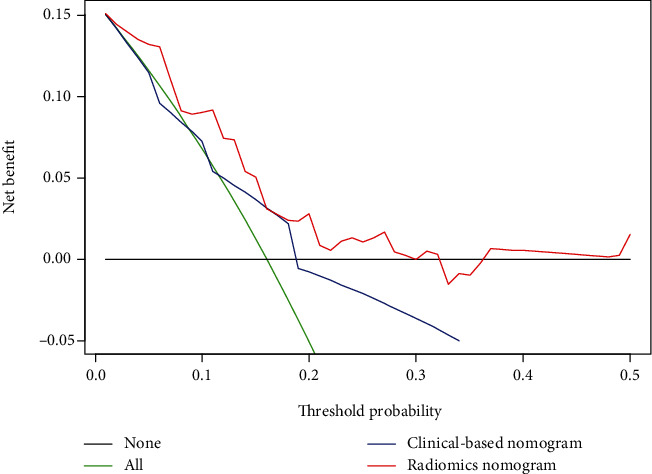
Decision curve analysis for the clinical-based nomogram and the radiomics nomogram. The y-axis represents the net benefit, whereas the x-axis represents the threshold probability.

Decision curve analysis for the clinical-based nomogram and the radiomics nomogram. The y-axis represents the net benefit, whereas the x-axis represents the threshold probability.