
Figure 3.
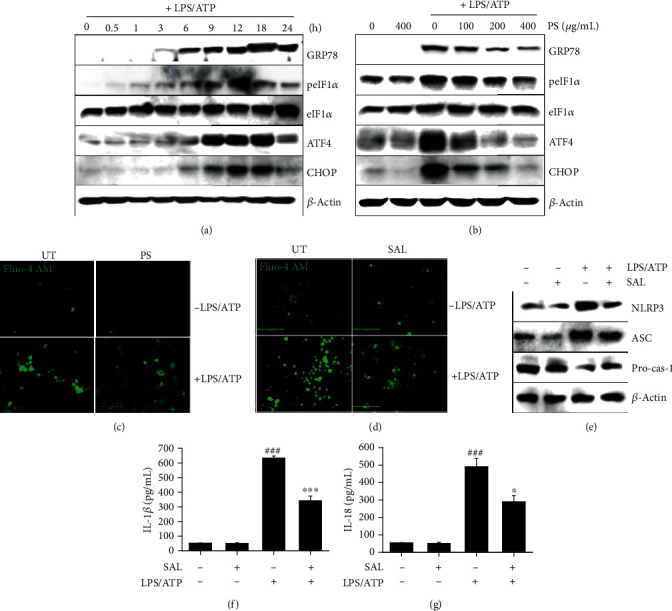
PS inhibit the LPS/ATP-induced NLRP3 inflammasome by downregulating ER stress-induced Ca2+ accumulation. (a) BV2 microglia cells were stimulated with LPS/ATP. Total proteins were isolated, and western blotting was performed. (b) In a parallel experiment, the cells were pretreated with the indicated concentrations of PS (0–400 μg/mL) for 2 h prior to stimulation with LPS/ATP for 12 h. Total protein was extracted, and western blotting was performed. BV2 microglia cells were pretreated with (c) PS (400 μg/mL) and (d) salubrinal (SAL, 10 μM) for 2 h prior to stimulation with LPS/ATP for 12 h. The cells were stained with 1 μM Fluo-4 AM, and cell images were captured using CELENA S Digital Imaging System. (e) Under SAL-treated conditions, the total protein was isolated at 12 h, and western blotting was performed. Cell culture supernatants were collected 48 h after treatment with LPS/ATP, and ELISA was performed to quantify the levels of (f) IL-1β and (g) IL-18. ###p < 0.001 vs. untreated cells; ∗∗∗p < 0.001 and ∗p < 0.05 vs. LPS/ATP-treated cells. UT: untreated cells.