
Figure 5.
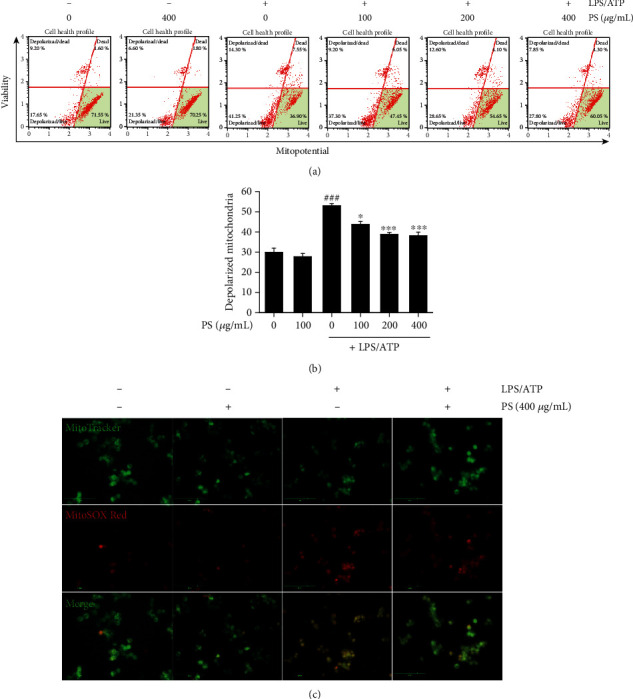
PS decrease mtROS production by stabilizing mitochondrial membrane integrity. (a) BV2 microglia cells were pretreated with the indicated concentrations of PS (0–400 μg/mL) for 2 h prior to stimulation with LPS/ATP for 12 h. (a) Mitochondrial membrane depolarized cell populations were measured using a Muse MitoPotential Kit. (b) Total populations of mitochondrial membrane depolarized cells were represented. (c) In a parallel experiment, the cells were stained with 0.5 μM MitoTracker Green and 2 μM MitoSOX Red, and cell images were captured by CELENA S Digital Imaging System. ###p < 0.001 vs. untreated cells; ∗∗∗p < 0.001 and ∗p < 0.05 vs. LPS/ATP-treated cells.