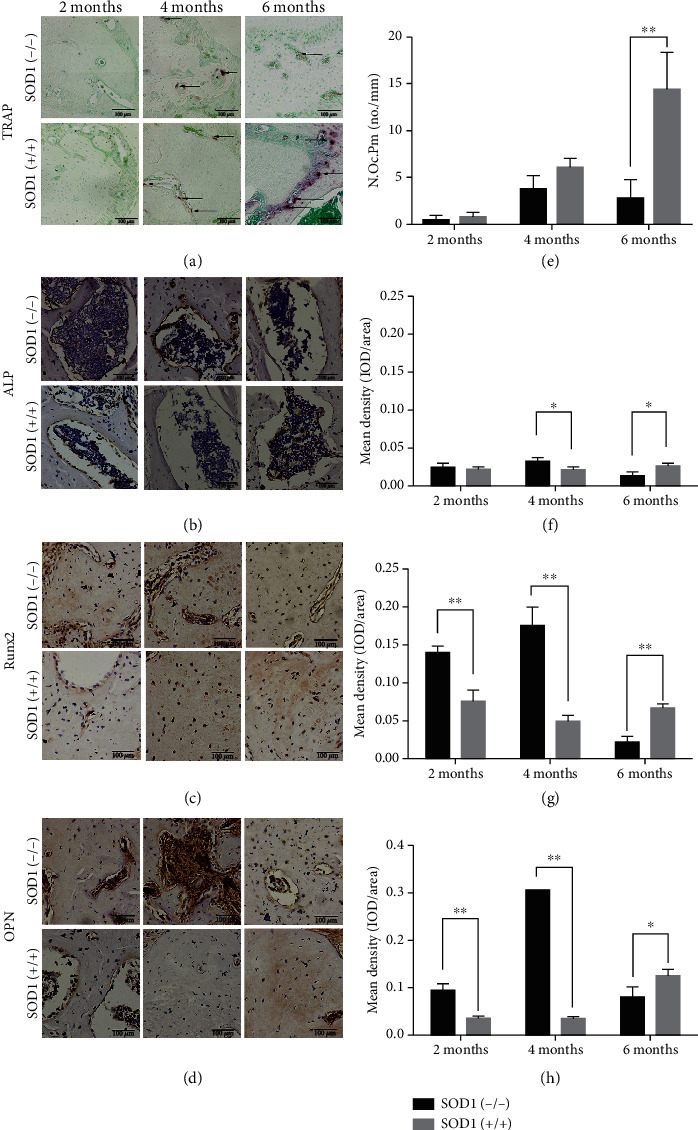
Figure 3.

Bone metabolism of the mandible in SOD1(-/-) male mice and wild-type male mice. (a) TRAP staining shows lower number of osteoclasts in alveolar bone under the alveolar crest of the mandibular first molar root bifurcation area of SOD1(-/-) mice. Arrows indicate active osteoclasts. (b) Immunohistochemistry of ALP in the same place. (c) Immunohistochemistry of Runx2 in the same place. (d) Immunohistochemistry of OPN in the same place. (e–h) Quantitative analysis of (a–d), respectively. Data are shown as mean ± SD (n = 5). ∗P < 0.05; ∗∗P < 0.01. Scale bars (a–d) 100 μm.
