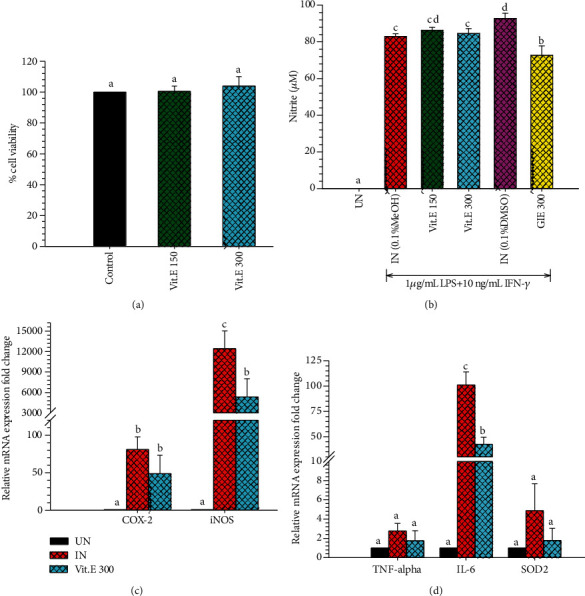
Figure 6.

(a) Cytotoxic effects of Vit.E on RAW264.7 cells for 24 h. MTT assay was used to determine cell viability. Values are expressed as a percentage of the control. (b) The effect of Vit.E compared to GIE on NO production in LPS plus IFN-γ-induced RAW264.7 cells. Nitrite concentration was determined from a sodium nitrite standard curve, and the results are expressed as a concentration (μM) of nitrite in a culture medium. The data represent the mean ± S.D. of three independent experiments. (c) The effects of Vit.E on COX-2 and iNOS mRNA expression in LPS plus IFN-γ-induced RAW264.7 cells. (d) The effects of Vit.E on TNF-α, IL-6, and SOD2 mRNA expression in LPS plus IFN-γ-induced RAW264.7 cells. The data represent the mean ± S.D. of two independent experiments. Cells were pretreated with GIE or DEX for 3 h and then coincubated with LPS plus IFN-γ for 24 h. UN: uninduced cells; IN: untreated LPS plus IFN-γ-induced cells; DEX: cells were pretreated with DEX at 1 μM; GIE 300: cells were pretreated with GIE 300 μg/mL; Vit.E (150 and 300): cells were pretreated with Vit.E 150 and 300 μg/mL, respectively. One-way ANOVA performed the comparison, and Tukey was used as a post hoc test. The degree of significance was denoted with different letters for the comparison between sample groups. p < 0.05 was considered as statistically significant.
