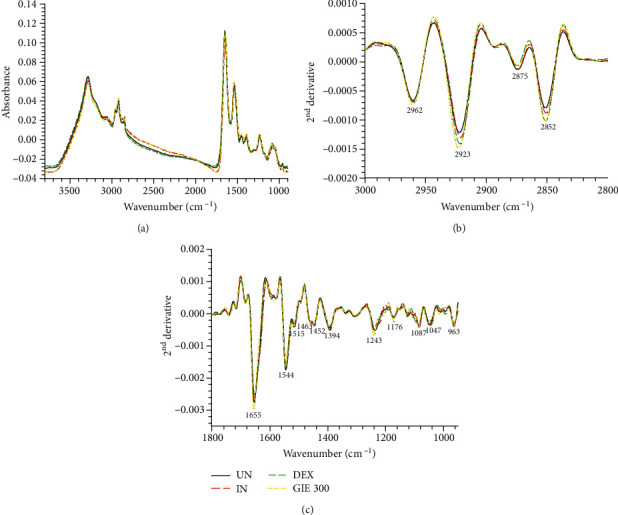
Figure 7.

FTIR spectra obtained using SR-FTIR and processed with a second derivative. (a) Average original FTIR spectra (3800-900 cm−1), (b) average the second derivative spectra of lipid regions (3000-2800 cm−1), and (c) average the 2nd derivative spectra of protein and nucleic acid and other carbohydrate regions (1800-950 cm−1). The data obtained from uninduced cells (UN, n = 70), untreated LPS plus IFN-γ-induced cells (IN, n = 70), 1 μM of DEX-treated cells (DEX, n = 70), and 300 μg/mL of GIE-treated LPS plus IFN-γ-induced cells (GIE300, n = 70).
