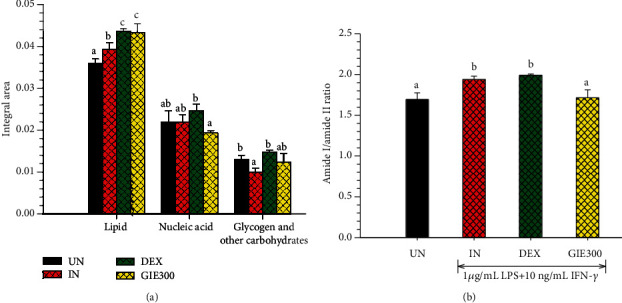
Figure 8.

Bar graph shows (a) integrated areas of remarkable lipid, nucleic acid, glycogen, and other carbohydrate regions and (b) the amide I/amide II ratio of 2nd derivative spectra. Data are represented as means ± S.D. for three replicates. The data obtained from uninduced cells (UN, n = 70), untreated LPS plus IFN-γ-induced cells (IN, n = 70), 1 μM of DEX-treated cells (DEX, n = 70), and 300 μg/mL of GIE-treated LPS plus IFN-γ-induced cells (GIE300, n = 70). One-way ANOVA performed the comparison, and Tukey was used as a post hoc test. The degree of significance was denoted with different letters for the comparison between sample groups. p < 0.05 was considered as statistically significant.
