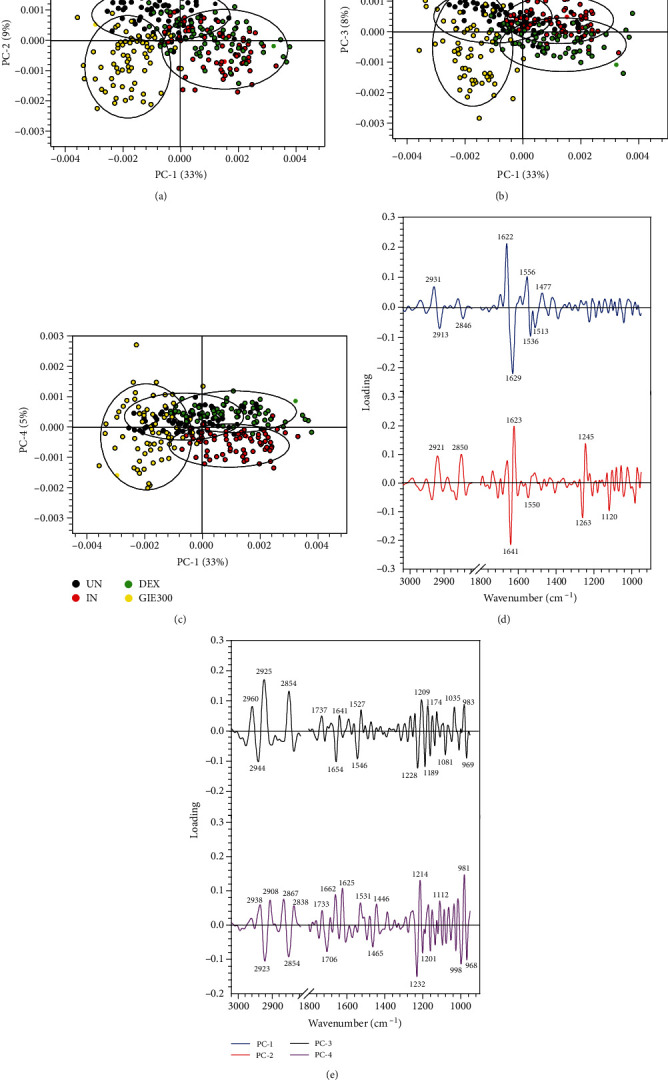
Figure 9.

PCA analysis of the FTIR spectra of uninduced cells (UN, n = 70), untreated LPS plus IFN-γ-induced cells (IN, n = 70), 1 μM of DEX-treated cells (DEX, n = 70), and 300 μg/mL of GIE-treated LPS plus IFN-γ-induced cells (GIE300, n = 70) in the spectral range of 3000-2800 cm−1 and 1800-950 cm−1 regions. PCA 2D score plot of (a) PC1 versus PC2, (b) PC1 versus PC3, and (c) PC1 versus PC4. PCA loading plot of (d) PC1 and PC2 and (e) PC3 and PC4.
