Figure 10.

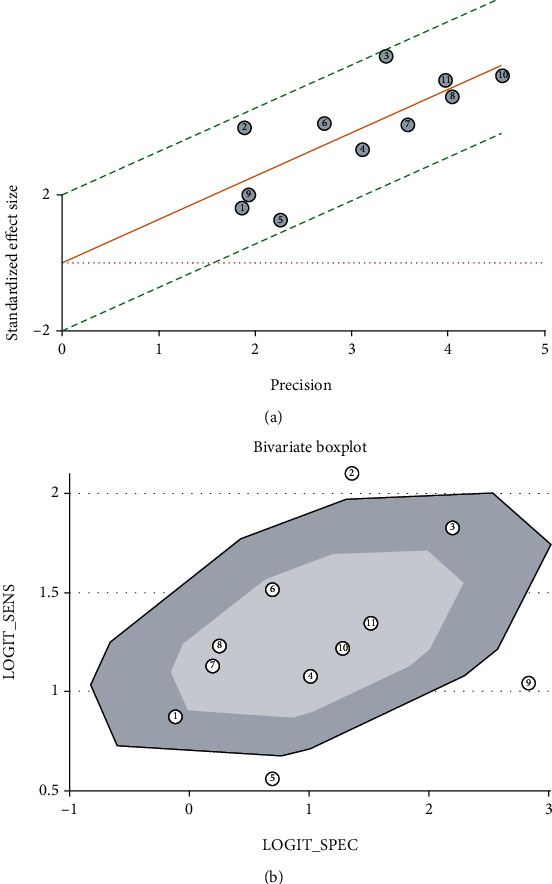
Heterogeneity test: (a) the Galbraith radial plot showed that all the studies were in the 95% CI region suggesting no heterogeneity; (b) there was heterogeneity for three studies beyond the middle region in the bivariate boxplot.

Heterogeneity test: (a) the Galbraith radial plot showed that all the studies were in the 95% CI region suggesting no heterogeneity; (b) there was heterogeneity for three studies beyond the middle region in the bivariate boxplot.