

Abstract
Acyl carrier proteins (ACPs) are small helical proteins found in all kingdoms of life, primarily involved in fatty acid and polyketide biosynthesis. In eukaryotes, ACPs are part of the fatty acid synthase (FAS) complex, where they act as flexible tethers for the growing lipid chain, enabling access to the distinct active sites in FAS. In the type II synthesis systems found in bacteria and plastids, these proteins exist as monomers and perform various processes, from being a donor for synthesis of various products such as endotoxin, to supplying acyl chains for lipid A and lipoic acid FAS (quorum sensing), but also as signaling molecules, in bioluminescence and activation of toxins. The essential and diverse nature of their functions makes ACP an attractive target for antimicrobial drug discovery. Here, we report the structure, dynamics, and evolution of acyl carrier proteins from three human pathogens: Borrelia burgdorferi, Brucella melitensis and Rickettsia prowazekii, which could facilitate the discovery of new inhibitors of ACP function in pathogenic bacteria.
Keywords: acyl carrier protein, NMR, fatty acid biosynthesis, protein structure, protein dynamics, Borrelia burgdorferi, Brucella melitensis, Rickettsia prowazekii
Introduction:
Acyl carrier proteins (ACP) participate in the biosynthesis of fatty acids (FA) and polyketides by tethering intermediates to the enzyme complex (1, 2). In yeast and mammals, ACP is a component of fatty acid synthase, a multifunctional enzyme complex, whereas in bacteria, ACP is a smaller monomeric soluble protein (3–7). The acyl chain is attached via a thioester linkage to a prosthetic phosphopantetheine group, whose length (~2 nm) and flexibility allows the growing chain to reach the distinct functional sites of the enzyme complex (3). In this capacity, acyl carrier proteins serve as anchors to which growing fatty acid or polyketide chains are tethered during their biosynthesis (8). In addition, ACPs have been associated with lipogenesis, which has an important role in the exploitation of some photosynthetic cyanobacteria as biofuels, in the production of phospholipids, and production of endotoxins important for pathogenesis. For performing these biological functions, the ACP has to covalently linked to a prosthetic group during the fatty acid synthesis, which occurs post-translationally (9).
ACP’s are small, ubiquitous, and highly conserved proteins containing 70-100 residues. Produced as apo-enzymes, ACP’s are activated by the attachment of phosphopantetheine to a conserved serine residue (10–12). A notable structural feature of ACP is the presence of three to four alpha helices that enclose the phosphopantetheine group (1, 2, 13, 14). Although these helices are referred to by multiple sources as “parallel,” they are not found in parallel orientations in many structures of ACP. In addition, the conformation of ACP could be dynamic, as this would suit its multiple functions. Flexibility of residues around the active site of ACPs could facilitate acyl chain insertion, extrusion and interactions with other enzymes (15).
The enzymatic roles of ACP’s are not restricted to participation in fatty acid synthesis (FAS). It is also involved in polyketide synthase, a complex similar to fatty acid synthases, during polyketide synthesis. It is also structurally similar to peptidyl carrier proteins (PCPs) and aryl carrier proteins (ArCPs) involved in nonribosomal peptide synthesis (16–18). Fatty acid biosynthesis occurs in multiple steps beginning with the transfer of the acyl group of acetyl-Coenzyme A to ACP and concludes with the transfer of the acyl group from ACP to Coenzyme A. The new fatty acid can then undergo subsequent modifications such as chain extension, the introduction of double bonds, and formation of triglycerides.
In this manuscript, we investigate the structural, dynamics, biophysics and evolution of acyl carrier proteins from the bacterial pathogens Borrelia burgdorferi, Brucella melitensis, and Rickettsia prowazekii (Figure 1). B. burgdorferi is a spirochete bacterium responsible for Lyme disease, transmitted zoonotically via the Ixodes tick, the world’s most common vector-borne bacterial disease (19). In humans, the bacterium primarily affects the skin, myocardium, synovial fluid and nerve tissues.
Figure 1:
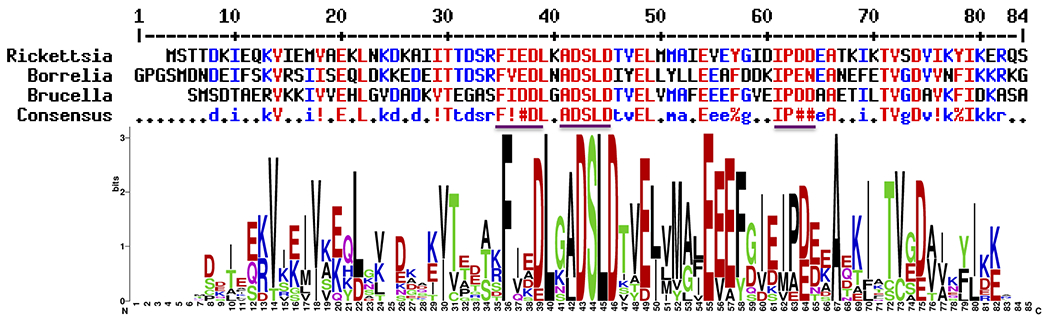
Sequence alignment of acyl carrier proteins from Borrellia (referred to as BoACP), Brucella (BrACP) and Rickettsia (RiACP). A consensus sequence is shown in the bottom line. Residues in red and yellow indicate identity and similarity, respectively. Programs Clustalw2 (62) and ESPript3.0 (63) were used for alignment. Stretches of high sequence similarity are highlighted in underlined color. The bottom figure provides a WebLogo representation (64) of multiple sequence alignment of 12 closely related sequences, including BoACP, BrACP and RiACP.
Brucella melitensis, a gram-negative bacterium, is the causative agent of ovine brucellosis in sheep. Consumption of unpasteurized milk can transmit the pathogen to humans, causing Malta fever. The bacterium has a coccbacillus-shape and is nonmotile, acting as an intracellular parasite (20). It particularly likes to infect phagocytic cells, including macrophages, and this preference reduces the hosts’s ability to resist both B. melitensis and other pathogens.
Finally, Rickettsia prowazekii, also an aerobic Gram-negative bacterium, is an obligate intracellular parasite. It is causative agent for epidemic typhus (21). It generates a protein microcapsular slime layer. R. prowazekii is transmitted by the feces of arthropods – in its disease capacity, typically the human body louse (22, 23). For the synthesis of lipids, this organism relies on the Type II Fatty Acid Synthesis Pathway, which is essentially driven by the enzyme 3-ketoacyl reductase. This enzyme is an acyl carrier protein and its structure has been found to resemble that of similar proteins from other pathogenic microorganisms.
Specifically, we investigate differences and similarities of acyl carrier proteins from these three pathogenic bacteria based on the structure, dynamics and thermodynamic stability, as well as phylogenetic analysis, to obtain insight into the evolution of ACP in these three pathogens. We show that ACPs from B. burgdorferi (referred as BoACP), and from R. prowazekii (RiACP) have very similar structure, dynamics and biophysics, whereas ACP from B. melitensis, referred henceforth as BrACP, has more distinct features. Moreover, NMR results elucidate the presence of ACP-protein interaction sites among these Gram-negative organisms. The conformational flexibility and dynamics of ACPs, we suggest, could play pivotal roles in substrate delivery because the acyl chain is first extracted from the protein and subsequently presented to the enzymes in order to facilitate FA synthesis and is therefore likely to sample multiple conformations during fatty acid synthesis.
Materials and methods:
Protein expression and purification
The reading frames corresponding to BoACP, BrACP, and RiACP were amplified using PCR and cloned under a T7 promoter into a pET28a-modified vector (AVA vector). Expression constructs were transformed into E.coli Rosetta cells. Cells were initially grown at 37 °C in M9 minimal medium containing 0.5 g/l 15NH4Cl and 2 g/l of 13C-Glucose. After reaching OD600 0.4-0.5, temperature was decreased to 22 °C and cells were induced at OD600 0.6-0.7 by addition of 0.3 mM isopropyl-β-thiogalactoside (IPTG) for 16-18 hrs. The proteins were purified using Ni-NTA column followed by 3C-protease cleavage of the His-tag and gel filtration. The proteins elute as a single peak corresponding to a monomer of the expected molecular weight and were confirmed by SDS-PAGE to be >95 % pure. The fractions from the gel filtration containing proteins were pooled, concentrated and quantitated by absorption at 280 nm using molar extinction coefficients ε280=2980M−1 cm−1 for BoACP and RiACP. The concentration for BrACP was measured using the Bradford assay as this protein lacks Trp and Tyr residues. The final NMR samples contained ~1.0 mM protein in 100mM KCl, 20mM potassium phosphate (pH 6.0) in 93% H2O plus 7% 2H2O or 99.9 % 2H2O.
NMR experiments
All NMR experiments were conducted at 25 °C on Bruker Avance 500 or 600 MHz spectrometers equipped with triple resonance cryo-probes and pulse field gradients. Experiments recorded on these proteins include sensitivity enhanced 2D [15N-1H]-HSQC, 3D HNCO, 3D HN(CA)CO, 3D CBCACONH, 3D CBCANH, 3D 15N-edited TOCSY-HSQC (mixing time 80 ms), 3D 15N/13C-edited NOESY-HSQC (mixing times 80 and 140 ms), and 2D GFT HNHA(24–26). H/D-exchange experiments were performed for BrACP in 100 % 2H2O to identify H-bonded residues. The data were processed with NMRPipe (27) and/or Topspin 3.0 and analyzed using CCPNMR (28). Proton chemical shifts were calibrated relative to 2,2-dimethyl-2-silapentane-5-sulfonate (DSS) at 25°C (0.00 ppm). Carbon and nitrogen chemical shifts were calibrated indirectly from the DSS reference. The assignments were deposited into BMRB under code 16856, 25695, and 18216 for BoACP, BrACP and RiACP, respectively.
Structure calculation
Cross peaks from 3D [1H-1H]-NOESY-[(15N-1H)/(13C-1H)]-HSQC and 2D [1H-1H]-NOESY spectra were integrated to obtain distance restraints with tolerance set for H, C and N to be 0.05, 0.15 and 0.30 ppm, respectively. Calibration and integration were done within the CANDID module of CYANA3.0 (29). A total of seven cycles of 100-200 structures were calculated and checked manually for violation of experimental restraints. In the final run, ensembles of 10-20 structures with the lowest energy were generated along with TALOS+ restraints (30). The calibration of cross peaks was done using the macro within CYANA with the minimum distance set to 2.2 Å and the maximum distance set to 6.2 Å. A table for constraints used for all three proteins in the CYANA runs is provided in Table 2. All atom pairwise-RMSDs were computed using CYANA3.0 and MOLMOL (31). The quality of all structures was checked using PROCHECK (32) and the protein structure validation software suite (PSVS 1.5) (33). The structures were submitted to PDB under code 2KWL, 2N57and 2LOL for BoACP, BrACP and RiACP, respectively.
Table 2:
NMR structural statistics for acyl carrier proteins
| BoACP | BrACP | RiACP | |
|---|---|---|---|
| Distance constraints | |||
| Total number of distances | 1113 | 991 | 1124 |
| (a) Short Range (|i-j|≤1) | 653 | 520 | 606 |
| (b) Medium range (1<|i-j|<5) | 245 | 298 | 301 |
| (c) Long range (|i-j|≥5) | 177 | 173 | 217 |
| (d) H-bonds | 26 | ||
| Dihedral angle constraints | |||
| φ | 60 | 70 | 70 |
| ψ | 60 | 70 | 70 |
| Violations | |||
| (a) Distance violations > 0.25 Å | 0 | 0 | 0 |
| (b) Van der Waals violations > 0.30 Å | 0 | 0 | 0 |
| (c) Bond angle violations > 5° | 0 | 0 | 0 |
| Average target function (Å2) | 1.28±0.09 | 0.17±0.03 | 0.41±0.09 |
| Average RMSD (Å) | |||
| (a) BB atom | 0.42±0.111 | 0.27±0.042 | 0.42±0.073 |
| (b) Heavy atom | 0.93±0.131 | 0.75±0.042 | 0.82±0.053 |
| Ramachandran plot statistics | |||
| Residues in most favored region (%) | 81.0 | 92.9 | 82.3 |
| Residues in additionally/generously allowed region (%) | 19.0 | 7.1 | 17.7 |
| Residues in the disallowed region (%) | 0.0 | 0.0 | 0.0 |
| Non-glycine and non-proline residues [n (%)] | 78 (100) | 72 (100) | 79 (100) |
| Glycine residues [n] | 4 | 5 | 1 |
| Proline residues [n] | 2 | 1 | 1 |
| Total residues [n] | 84 | 78 | 81 |
- range 8-82,
- range 3-77,
- range 4-80
NMR relaxation Experiments
The 15N-relaxation measurements (T1, T2 and NOE) were carried out on Bruker Avance 500 and 600 MHz spectrometers at 25 °C (34, 35). The relaxation data sets were acquired using 256 complex t1 increments with the 15N sweep-width set to 36 ppm. Along the t2-dimension, 2048 complex data points were recorded with a sweep width of 12 ppm. The number of scans per t1 increment for both the T1 and T2 data was set to 16, while it was 48 for the heteronuclear-nOe experiment. T1 experiments were recorded with the following delays: 11.2, 22.3*, 44.5, 89.7*, 190.6, 203.7*, 437.2, 605.4*, 807.2 and 1076.3 ms, while T2 experiments were performed with delays of 16.7, 33.4*, 50.1, 66.8*, 83.5, 100.5*, 116.9, 133.6, 167.0 and 192.5 ms. The experiments marked with asterisks (*) were repeated twice to check the reproducibility of the T1 and T2 data. Furthermore, two NOE datasets were collected: one with a 3.0 s recycle delay followed by a 3.0 s pre-saturation period, and the second with a 6s recycle delay without any pre-saturation at the spectrometer frequency. To confirm protein stability, a sensitivity-enhanced 2D [15N-1H]-HSQC was always recorded before and after recording each relaxation data set. The relaxation data were processed using NMR Pipe/Topspin 3.0 and analyzed using CCPNMR (28).
Determination of 15N-Relaxation Parameters (R1, R2, and NOE)
R1 (1/T1), R2 (1/T2) and steady-state NOE spectra were processed to achieve maximum peak heights. Intensities (or peak heights; in arbitrary units) of various [15N-1H] cross peaks in these spectra were measured using CCPNMR. Uncertainty in peak heights was estimated using the duplicate spectra. The standard deviations were found to be <5% for the entire relaxation data set. After calculating peak heights and their respective errors, time points were fitted to a single exponential decay function:
to derive the corresponding R1 and R2 values, where I(t) is the intensity at a delay time of t (ms) used in the measurement of R1 and R2 values. A plus B corresponds to the intensity value at the initial time (t = 0), and A is the steady-state value, the intensity at t = ∞.
The 15N-1H heteronuclear NOE was calculated from the equation: NOE=Isat/Ieq, where Isat and Ieq are the intensities of a [15N-1H] peak in the spectra recorded with and without proton saturation.
Model-free analysis
Model-free analysis was done using the GUI based approach in relax 3.3.3 (36, 37). The following models were selected with 15 grid search increments and 1,000 Monte Carlo simulations with maximum iterations of 30. The models used are m0= {}; m1= {S2}; m2= {S2, te}; m3= {S2, Rex}; m4= {S2, te, Rex}; m5= {S2, Sf2, te}; m6= {S2, tf, Sf2, ts}; m7= {S2, Sf2, ts, Rex}; m8= {S2, tf, S2f, ts, Rex}; m9= {Rex}. Results of this analysis for three different acyl-carrier proteins are provided in Tables 3 and 4.
Table 3:
Comparison of backbone dynamics parameter for acyl carrier proteins
| BoACP | BrACP | RiACP | |
|---|---|---|---|
| Motional parameters for residues in regular secondary structures (500 MHz/600 MHz) | |||
| Average R1 (s−1) | 2.49 (±0.12)/2.19 (±0.10) | 2.32 (±0.05)/2.05 (±0.04) | 2.51(±0.05)/2.15(±0.04) |
| Average R2 (s−1) | 8.49 (±0.42)/7.78 (±0.39) | 8.63 (±0.17)/8.96 (±0.18) | 8.10(±0.16)/7.22(±0.14) |
| Average nOe | 0.69 (±0.03)/0.75 (±0.05) | 0.66 (±0.02)/0.74 (±0.02) | 0.69(±0.01)/0.76(±0.02) |
| Average S2 | 0.84 (±0.02) | 0.75 (±0.02) | 0.83 (±0.02) |
| Average τe (ns) | 0.71 (±0.01) | 0.68 (±0.05) | 1.04 (±0.02) |
| Average Rex (s−1) | 1.82 (±0.04) | 1.66 (±0.08) | 1.69 (±0.04) |
| Average S2/τe (ns)/Rex (s−1) of helices and loop | |||
| α1 | 0.78/1.49/2.20 | 0.82/1.30/1.35 | 0.83/1.57/1.86 |
| loop1 | 0.84/0.66/1.04 | 0.79/0.35/1.99 | 0.86/1.20/1.41 |
| α2 | 0.90/0.07/1.40 | 0.77/0.04/2.05 | 0.81/0.86/2.33 |
| loop2 | 0.76/0.80/1.01 | 0.74/0.01/3.25 | 0.65/NO/1.27 |
| α3 | 0.76/1.40/2.58 | 0.63/0.08/1.76 | 0.77/2.70/1.29 |
| loop3 | 0.82/0.05/ NO | 0.78/NO/NO | 0.63/NO/0.92 |
| α4 | 0.90/0.11/NO | 0.69/0.03/1.34 | 0.87/0.06/0.38 |
NO- not observed
Table 4:
Output of model-free runs from the program Relax
| Parameters | Protein name | ||
|---|---|---|---|
| BoACP | BrACP | RiACP | |
| Diffusion type | Sphere | Spheroid | Spheroid |
| Overall correlation time | 5.3 ns | 4.6 ns | 5.2 ns |
| Diso (rad/s) | 3.1e+07 | 3.6e+07 | 3.2e+07 |
Thermal and denaturation unfolding
The thermal and denaturant-induced unfolding measurements were performed on a JASCO 720 circular dichroism (CD) spectrometer. For thermal unfolding, concentrations 64 μM, 42 μM and 48 μM were used for BoACP, BrACP and RiACP, respectively whereas concentrations 12 μM, 14 μM and 40 μM were used for guanidine hydrochloride (GdmCl) denaturation experiments for BoACP, BrACP and RiACP, respectively. All experiments were repeated thrice with independent sample preparation and were checked for reproducibility of the measurements.
For thermal unfolding, far-UV CD spectra were recorded in the range of 200 to 260 nm with a scan speed of 50nm/min with a quartz cell having a path length of 0.1 cm. The temperature range of 20-100 °C were used for measurements with a ramp rate of 2 °C/min. The data were collected for 8 accumulations with 5 mins equilibration at each temperature point and were corrected for buffer-baseline. The melting temperature (Tm) was obtained using a two-state model (38–43).
For GdmCl unfolding, far-UV CD spectra were recorded in the range of 210-260 nm with scan speed of 40 nm/min in similar quartz cells to those used for thermal unfolding. Each spectrum was collecting by averaging 6 scans. The protein samples with various GdmCl concentrations in the range of 0 to 6M were prepared and equilibrated for at least a period of 8-12 hrs. The GdmCl unfolding data were fit to a two-state model and parameters were determined by non-linear curve fitting to the following equation in origin (www.originlab.com) (40–42, 44),
Here, F app is the observed CD value; F0 and F1 represent the CD signal of fully folded and fully denatured proteins, respectively; ΔG and m1 represent the free energy change and slope of the transition, respectively; D is the denaturant concentration; R is the universal gas constant (1.987 cal K−1 mol−1) and T is temperature (298 K).
Phylogenetic analyses
Phylogenetic analyses of 39 sequences of acyl carrier protein taken from all the three domains of life (Eukarya, Archaea and Eubacteria) were performed using MEGAX software (45). These sequences were downloaded either from the NCBI database or from UniProt. The Multiple Sequence Alignment was done using MUSCLE (46). To infer the evolutionary history, UPGMA (unweighted pair group method with arithmetic mean) method was used. The tree is drawn to scale, with branch lengths in the same units as those of the evolutionary distances used to infer the phylogenetic tree. The p-distance method was used to compute the evolutionary distances and is represented in the units of the number of amino acid differences per site. Pairwise deletion option was selected to ensure that all ambiguous positions were removed for each sequence pair.
Results and Discussion:
Stability of three acyl-carrier proteins
Acyl carrier protein are metabolically stable and required for de novo synthesis of fatty acids (47). We investigated the thermodynamic stability of three ACP proteins: BoACP, BrACP, and RiACP by measuring the melting temperature and transition mid-point in the presence of guanidine-HCl (GdmCl) using circular dichroism (CD), as described in the Materials and methods. Figure 2A shows the thermal melting curves for BoACP, BrACP, and RiACP in blue, green and red circles, respectively. The ellipticity values at 220 nm at various temperature points in the range of 20-100 °C are used to obtain the melting temperature (Tm). The Tm for BoACP was 72.7 (±0.4) °C, close to what is measured for RiACP (73.8±0.4 °C), whereas BrACP has a melting temperature of 60.8 ±0.3 °C, which is almost 12 °C lower than what is observed for BoACP and RiACP (Table 1). This difference might be attributed to the presence of a long loop 1 of about 18 residues located near the active site of BrACP.
Figure 2: Thermodynamic stability of the three acyl carrier proteins, BoACP, BrACP and RiACP.

(A) Thermal denaturation of acyl carrier proteins as monitored by CD. Protein concentrations of 64 μM, 42 μM and 48 μM were used for BoACP, BrACP and RiACP, respectively. The melting temperature (Tm) was obtained by fitting the CD data using a two state equation (40–42, 44). (B) GdmCl-induced unfolding of acyl carrier proteins as monitored by CD. The data were fit to the two state denaturation model. Protein concentrations of 12 μM, 14 μM and 40 μM were used for the measurement for BoACP, BrACP and RiACP, respectively. The data were fit to a two state model and parameters were determined by a non-linear curve fitting (40–42, 44)
Table 1:
Thermodynamic parameters for unfolding of BoACP, BrACP and RiACP
| Parameters | Protein sample | ||
|---|---|---|---|
| BoACP | BrACP | RiACP | |
| Tm (°C) | 72.7±0.4 | 60.8±0.3 | 73.8±0.4 |
| ΔH (kcal/mol) | 31.7±0.2 | 45.1±0.2 | 32.1±0.2 |
| Parameters | Protein sample | ||
| BoACP | BrACP | RiACP | |
| m1-value(kcal/mol.M) | 2.95±0.13 | 3.29±0.16 | 2.83±0.14 |
| ΔG° (kcal/mol) | 2.15±0.18 | 2.04±0.23 | 0.73±0.15 |
Figure 2B depicts the GdmCl induced unfolding of BoACP, BrACP, and RiACP in blue, green and red circles, respectively. Almost no changes are observed until the concentration of GdmCl reached 1.2 M, followed by a sharp change in the CD signal between 1.2 and 3.8 M, with no change afterwards, consistent with a highly cooperative unfolding transition. The unfolding of all three proteins is easily fit using a two state model (40–42, 44) with transition mid-points of 2.95 (±0.13), 3.29 (±0.16) and 2.83 (±0.14) M for BoACP, BrACP, and RiACP, respectively (Table 1). BrACP has a distinct and higher GdmCl midpoint compared to the other two proteins (BoACP and RiACP). These observations suggest that BrACP is less thermally stable among all three proteins and yet, surprisingly, has a lesser propensity to unfold in the presence of denaturing agents, perhaps due to the presence of fewer charged residues near the active site (Figure 1).
NMR investigations of the three ACP proteins
Figure 3 shows the 1H-15N spectra collected for BoACP, BrACP, and RiACP at 25 °C. All assigned residues are labeled with sequence number followed by the amino acid symbol. The protein BoACP is free of Cys/His/Trp whereas BrACP and RiACP are devoid of Asn/Cys/Gln/Trp and Cys/Trp, respectively. The assignments BoACP were taken from previous published work (48) whereas assignments for BrACP and RiACP were carried out with the concerted use of HNCO, HN(CA)CO, CBCACONH, CBCANH, HCCH-TOCSY, 15N/13C-edited NOESY-HSQC (mixing times 80 and 140 ms), and 2D GFT HNHA experiments (24), which were used to assign the side-chain proton and carbon resonances. We could assign almost all the residues for these proteins: the extents of assignments were 98%, 94% and 95% for the backbone of BrACP, and RiACP, respectively. The missing assignments are limited to unfolded residues from the N-terminus of these proteins. In the case of BoACP, three amide resonances (Arg34, Ile61 and Glu70) are shifted downfield in the HSQC spectrum due to their involvement in hydrogen bonding (48). In the case of BrACP, two amide resonances (Ser28 and Ile55) seem to be involved in hydrogen bonding since they are shifted downfield as well, whereas RiACP has three amide resonances (Arg31, Ile58 and Lys67) shifted downfield due to their involvement in hydrogen bonding formation. Interestingly, the three downfield shifted residues of BoACP and RiACP are at very similar positions and are identical, except for Glu70 in BoACP and Lys67 in RiACP. The similarity in the three downfield shifted residues in BoACP and RiACP suggests these residues structurally analogous, whereas two downfield shifted residues in BoACP might be playing different roles. The assignments were deposited into BMRB under code 16856, 25695 and 18216 for BoACP, BrACP and RiACP, respectively.
Figure 3: Sensitivity-enhanced 2D [15N-1H] HSQC of acyl carrier proteins.

HSQC spectra for BoACP (A), BrACP (B) and RiACP (C) recorded on Bruker AMX 500 MHz spectrometer at 25°C. These spectra were recorded with 128 and 1024 points along the t1 and t2 dimensions, respectively. Individual peak assignments are shown with the corresponding residue number followed by the amino acid type. Side-chain NH2 are identified by horizontal lines for BoACP (A) and RiACP (C); BrACP (B) does not have any Asn and Gln.
NMR Structure and comparison of three acyl-carrier proteins
The structures of targets BoACP, BrACP, and RiACP were determined using NMR and are shown side by side in Figure 4 (the structure of BoACP was taken from our previous work (48)). A total of 1113, 991 and 1124 distance constraints (an average of ~11-15 constraints per residue) were used for BoACP, BrACP and RiACP, respectively (Table 2). In the case of BoACP, 653 short range, 245 medium range and 177 long range distance constraints were used in the structure calculations whereas 520 short range, 298 medium range and 173 long range distance constraints were applied for BrACP structure calculation along with 26 H-bonding distance constraints. The structure calculation for RiACP was performed with 606 short range, 301 medium range and 217 long-range distance constraints. Dihedral angle constraints were generated by TALOS+ on the basis of assigned chemical shifts(30). An ensemble of 10-20 structures with target functions of 1.28, 0.17 and 0.41 Å2 with no distance constrain violation > 0.30 Å and no angle constrain violation > 5° were analyzed for BoACP, BrACP and RiACP, respectively. The quality of these superimposed 3D structures was evaluated with PROCHECK (32) and their structural statistics are reported in Table 2. These proteins do not have any residue within disallowed regions, with ~80 % residues (non-Glycine and non-Proline) falling into the most favored region. The structures were deposited into the PDB database under accession code 2KWL, 2N57 and 2LOL for BoACP, BrACP and RiACP, respectively.
Figure 4: NMR structure of BoACP, BrACP and RiACP.
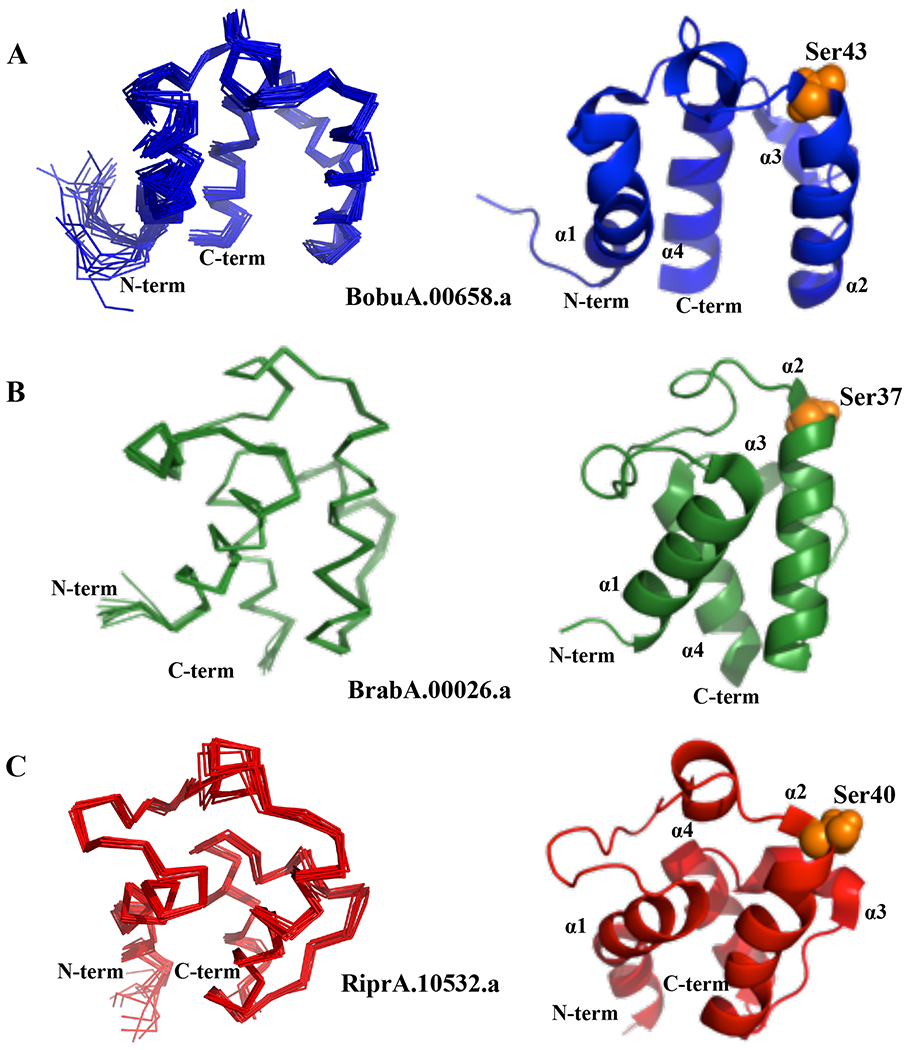
Ensemble and representative cartoon structures of (A) BoACP (RMSD=0.42±0.11 Å), (B) BrACP (RMSD=0.27±0.04 Å) and (C) RiACP (RMSD=0.42±0.07 Å) are shown in blue, green and red, respectively. The N- and C-termini of the proteins are marked on the structure. The four α–helices are also marked as α1, α2, α3 and α4 on each respective structure. The images were generated with pymol (http://pymol.org/). Active site residues are identified with orange sphere.
All three acyl carrier proteins have four alpha helices in their core structure, similar to acyl carrier protein from R. palustris and others (13, 14). In the case of BoACP, the four α-helices span residues 7-22, 43-57, 64-68 and 72-83. For BrACP, the four α-helices span residues 3-17, 36-52, 58-63 and 65-78. Finally, for RiACP, four distinct α-helices and one 310 helix span residues 3-19 (α1), 31-36 (310), 39-55 (α2), 60-66 (α3), and 68-80 (α4). BoACP and RiACP show similar features and folds for their structure, whereas BrACP has a more divergent structure with different inter-helical angles (Supplementary Table 1, Figure 4 and Figure 5). All three proteins have longer α1, α2 and α4 whereas α3 always contains only 5 to 7 amino acids The orientations of α1 and α2 are very similar in BoACP and RiACP, with an inter-helical angle of about 150°, whereas the same helices in BrACP make a narrower angle of 122°. The α3-α4 inter-helical angles are similar in BoACP and RiACP with values of 112 and 120°, respectively, whereas BrACP shows a more distinctive feature, with an angle of 144°(Table S1, Figure 5). N- and C-terminal residues in all three proteins are unstructured and lack amide-amide and amide-side chain NOEs. The similar topologically organization of helices in BoACP and RiACP might indicate closer functional or evolutionary relationship, whereas BrACP seems to be more distinct. These helices are arranged to form a scaffold which accommodates the acyl chain via formation of a hydrophobic pocket during fatty acid synthesis (49, 50).
Figure 5: Orientation of α-helices in ACP proteins.
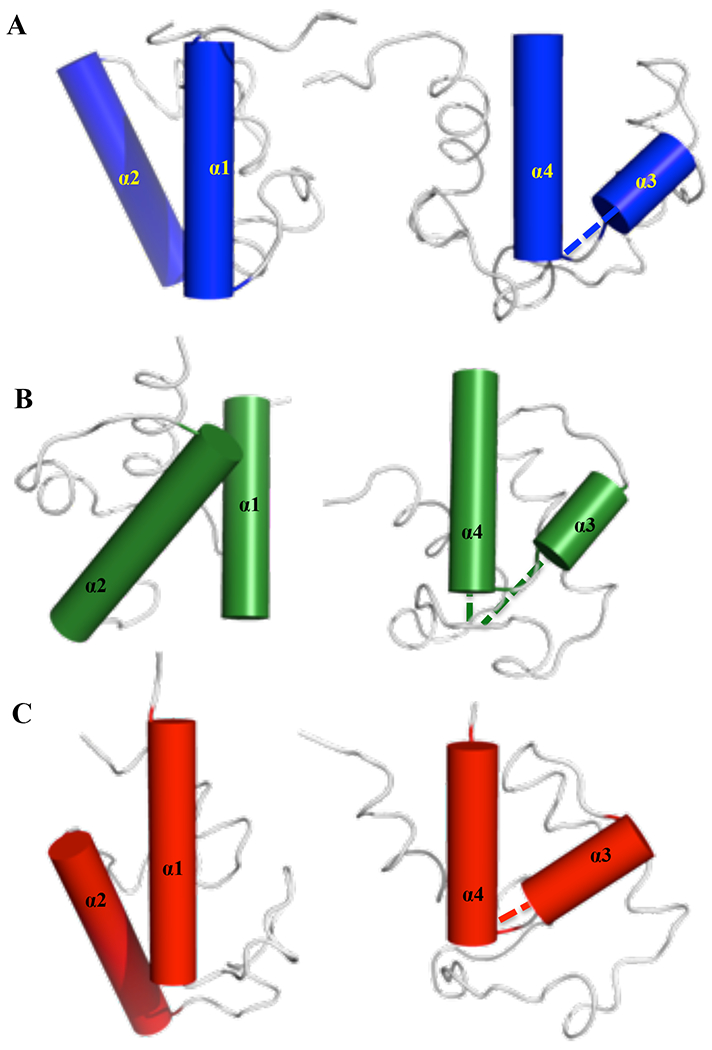
Relative orientation of α1-α2 and α3-α4 for (A) BoACP, (B) BrACP and (C) RiACP, shown in blue, green and red, respectively. The BoACP and RiACP have very similar orientation of the four helices, whereas BrACP has a more distinct inter-helical orientation. The α3-α4 helices are extended with dotted lines to visualize the angle between them.
Dynamics of acyl-carrier proteins
The 15N-relaxation rates (spin-lattice; R1, spin-spin; R2) and heteronuclear 1H-15N Overhauser effects (nOe) were measured at 25 °C and two different magnetic field strengths (600 and 500 MHz) for all three proteins, BoACP, BrACP and RiACP. Proline residues (2, 1 and 1 for BoACP, BrACP and RiACP, respectively) and various N-terminal residues (2, 0 and 4 for BoACP, BrACP and RiACP, respectively) that did not have amide resonance observable in the 1H-15N HSQC are not included in this study. Thus, we carried out relaxation dynamics study for 77 residues out of 84, 74 out of 78 and 74 out of 81 in proteins BoACP, BrACP and RiACP, respectively. The average R1, R2 and nOe values for these three proteins are reported in Table 3.
The spin-lattice relaxation rates (R1) are mostly constant throughout the sequence as they are only sensitive to nanosecond-picosecond time scale motion (44). The average values of R1are 2.49 (500 MHz)/2.19 (600 MHz) s−1, 2.32 (500 MHz)/2.05 (600 MHz) s−1 and 2.51(500 MHz)/2.15(600 MHz) s−1 for BoACP, BrACP and RiACP, respectively (Table 3). The terminal residues in these proteins show lower values of R1, suggesting their involvement in faster time scale motions (Figure 6). In protein BoACP, residues Asp7, Asp8, Glu9, Glu63 and Asn64 show high amplitude motions, whereas residues Asp3, Glu25 andGly26 for BrACP and residue Lys6 for RiACP show large value of R1 as well.
Figure 6: 15N- relaxation parameter for BoACP, BrACP and RiACP.

(A) Longitudinal relaxation rates (R1), Transverse relaxation rates (R2) and [1H-15N] nOe enhancements for BoACP are represented with dark blue triangles (600 MHz) and blue circles (500 MHz), (B) R1, R2 and nOe for BrACP are shown with dark green triangles (600 MHz) and green circles (500 MHz), and (C) R1, R2 and nOe for RiACP are shown in dark red triangles (600 MHz) and red circles (500 MHz). The secondary structures for all three proteins are shown with the rectangular bars in blue, green and red for BoACP, BrACP and RiACP, respectively.
The spin-spin relaxation rates (R2) vary throughout the sequence and provide insight into millisecond to microsecond time scale conformational exchange. The R2’s range from around 8.49 (500 MHz)/ 7.78 (600MHz) s−1, 8.63 (500 MHz)/8.96 (600 MHz) s−1 and 8.10 (500 MHz)/7.22 (60MHz) s−1 for BoACP, BrACP and RiACP, respectively (Table 3). There are few residues in BoACP and RiACP that show a higher R2 value >7.5 s−1 whereas protein BrACP has many residues with higher value of R2, suggesting their involvement in conformational exchange (Figure 6B). This is probably due to the presence of extended loops in BrACP (Figure S1).
The heteronuclear 1H-15N Overhauser effect (nOe) values give information about regions experiencing high frequency motions. It is clear from Figure 6 that the first 5 residues, Gly1 to Met5, and the last residue, Gly84, of BoACP have negative nOes due to the presence of high flexibility, and, in BrACP, negative nOe values are seen for first N-terminal and last C-terminal residue i.e., Met1 and Ala78, respectively, whereas protein RiACP shows high flexibility for residueAsp41 and the C-terminal residue Ser81. The average nOe values range between 0.69 (500 MHz)/0.75 (600 MHz) for BoACP, 0.66 (500 MHz)/0.74 (600 MHz) for BrACP and 0.69 (500 MHz)/0.76 (600 MHz) for RiACP.
Comparative study of dynamics in acyl-carrier proteins
The dynamics data acquired at the two magnetic fields were used to obtain information about residue specific order parameter (S2), internal motion (τe in ns) and conformational exchange (Rex in s−1) (Figure 7), along with overall correlation time (Table 3 and Table 4). The program relax (36, 51) was used for model-free calculations (52–56), as detailed in the materials and methods. The overall correlation time obtained for all these proteins were in the range of 4.6-5.3ns, which corresponds to what is expected for a well-folded protein of about 10-kDa molecular weight. The overall correlation time is calculated from the residues who have a nOe value > 0.65. Both anisotropic and isotropic models (57–59) were included in the relax-run and the output is provided in the Table 4.
Figure 7: Model-free dynamic parameters for BoACP, BrACP and RiACP plotted as a function of residue number.

S2, τe (ns) and Rex (s−1) are plotted for (A) BoACP (blue), (B) for BrACP (green) and (C) RiACP (red). The secondary structures are shown with rounded rectangular bars on top. The residues with high internal motion or significant exchange contribution to relaxation rates are shown with amino acid number followed by amino acid type.
The order parameter (S2) is used to provide a measure of the rigidity of the secondary structure to motions occurring at ns and faster time scales (Figure 7). The average S2values for secondary structures BoACP, BrACP and RiACP are 0.84, 0.75 and 0.83 respectively. The protein BrACP has significantly different S2 values along the entire sequence, by comparison with other two acyl-carrier proteins. The α3 and α4 helices in BrACP show the lowest value of S2 and highest flexibility of all three proteins (Figure 7 and Figure 8).
Figure 8: Salient dynamics features of the three proteins plotted on their NMR structure.

(A), (D) and (G) present order parameter (S2), internal motion τe (ns) and conformation exchange Rex (s−1) values marked on the structure of BoACP; (B), (E) and (H) present S2, τe (ns) and Rex (s−1) values, respectively on BrACP structure and (C), (F) and (I) present S2, τe (ns) and Rex (s−1) values, respectively, shown on the NMR structure of RiACP. S2 values are marked with a gradient of red to grey, where red corresponds to a low S2 value of 0.1 and grey to a high value of 1.0; internal motions are shown with a gradient of white to blue color, white being low and blue being high motion. The exchange term is also shown with a gradient of grey to red color, where grey represents very small conformational exchange whereas red represents Rex ~ 4.0 s−1. Active sites are shown with green spheres.
The analysis of sub-nanosecond internal motions provides further insight. In the case of BoACP, residues Asp8, Glu9, Asp32, Glu63 and Asn64 have internal motions on time scales ranging from 400-7,000 ns as deduced from model-free analysis, whereas residues Asp3, Thr4 and Gly26 of BrACP and residues Asp5, Lys6, Thr28, Asp29, Ser40 and Asp60 of RiACP have internal motions at similar rates (Figure 7). All of these residues are within loops or at the beginning of secondary structure elements. Interestingly, Asp32 in BoACP is close to the ligand-binding residue (Ser43) whereas Ser40 in RiACP is directly involved in ligand binding (Figure S2). We also notice that C-terminal residues do not experience any internal motion due to their participation in the structural core of the protein, which restricts their motion (Figure 8D, 8E and 8F). We did not observe any internal motion for loop3 in BrACP and for loop2 and loop3 in RiACP (Table 3).
The conformational exchange term (Rex in s−1) depicts the contribution to dynamics of millisecond to microsecond time scale motions. We found that 13 residues in BoACP, 27 residues in BrACP and 12 residues in RiACP have Rex value >1 s−1, as marked on Figure 7 and Figures 8G, 8H and 8I. The residues with exchange contribution in BoACP are Gly3, Ser4, Met5, Asn7, Asp8, Glu9, Asp32, Asp42, Asp45, Glu54, Phe57, Glu63, and Asn64. For BrACP, residues Ser2, Asp3, Thr4, Glu6, His15, Ala20, Asp21, Val23, Glu25, Gly26, Leu33, Asp36, Ser37, Thr40, Val41, Leu43, Val44, Met45, Glu48, Asp57, Asp58, ala60, Glu61, Thr62, Ile63, Val66 and Phe72 show Rex>1 s−1. For RiACP, residues Asp5, Lys6, Lys23, Ile25, Thr28, Asp29, Ser40, Ile58, Asp60, Asp61, Thr64, and Lys67 show greater contribution to motion from ms-μs exchange. BrACP has many residues at or near the ligand binding site having substantial Rex contribution, compared to BoACP and RiACP (Figure S3).
It is interesting to note that α1 helix of BoACP and RiACP has higher average of Rex compared to α1 of BrACP. A completely opposite situation is seen in α4; in BoACP, no effective Rex was observed while RiACP shows a low value of 0.4 and BrACP shows a higher value of 1.3 for this helix. It is worth mentioning that α1, α2 and α4 helices are longer in length in all three proteins whereas α3 is 5-7 amino acid long with distinct relaxation features (Table 3). In the case of α2 and α3, all three proteins show different range of Rex values. We believe that the different Rex value in all helices of BoACP, BrACP and RiACP originates from the different inter-helical orientation. Here, loop1 and loop3 of all three ACPs show inconsistent behavior with respect to their dynamics values whereas loop2 in BrACP has high Rex values, compared to BoACP and RiACP (Figures 7 and 8; Table 3). These results can be summarized by the statement that BoACP and RiACP have similar dynamics features, whereas BrACP is more distantly related. Further, it is also evident that BrACP would have various degree of conformational exchange near the active site compared to the other two ACPs (Figures S1 and S3) which might affect ligand binding.
Phylogenetic relationships
In order to understand the evolutionary relationship of proteins BoACP, BrACP and RiACP, we performed a phylogenetic analysis of ACP sequences from 39 diverse species. The optimal tree with the sum of branch length 11.55757817 was used for the analysis. By subjecting these ACP sequences to phylogenetic analysis, we observed that B. burgforferi (BoACP) and R. prowazekii (RiACP) both are sister groups (closest relatives) that split from same node. This observation further reinforce our NMR and biophysical results, that these two gram-negative bacteria have similarities between their acyl carrier proteins, whereas B. melitensis (BrACP) is out-grouped relative to both B. burgforferi and R. prowazekii (Figure 9).
Figure 9: Phylogenetic analysis of acyl carrier proteins near BoACP, BrACP and RiACP.

The tree was constructed from 39 taxa containing acyl carrier proteins to infer the evolutionary relationships with BoACP, BrACP and RiACP using MEGA X software (45). A multiple sequence alignment was done using MUSCLE and UPGMA method to infer the evolutionary history. Here, numbers of nodes represent the reliability of grouping tested by the program. In this tree, the numbers in brackets depicts node ids, which basically represents common ancestors of descendant’s taxa. The three proteins (BoACP, BrACP and RiACP) under this study are highlighted in boxes.
Conclusions
In this work, we compare the NMR structure and dynamics, as well as thermodynamic stability of three acyl carrier proteins from B. burgforferi, B. melitensis and R. prowazekii. All three proteins contain four α-helices with BoACP and RiACP having nearly identical inter-helix orientation, whereas BrACP has a more divergent arrangement of the helices. The study of dynamics at two different NMR field strengths shows that BoACP and RiACP have similar dynamical features among helices and loops as well, whereas BrACP has several stretches where conformational exchange is observed, perhaps associated with its unique helical arrangement. The similarity of BoACP and RiACP was further established with the thermal melting, unfolding studies and phylogenetic analyses, which supported the overall conclusion that acyl carrier proteins in B. burgforferi and R. prowazekii are closely related, while the acyl carrier protein from B. melitensis is distinct in structure, dynamics and biophysical behavior. The 3D structures identify a triad of basic and polar amino acids, RxxExxK and RxxExxN, which precede Ser43 in BoACP and Ser40 in RiACP, respectively; but are absent in BrACP. This observation leads us to speculate that the mode of phosphopantetheine binding would be similar in B. burgforferi and R. prowazekii and might regulate their function and related to the low infectivity rate of nymphs (60). Our analysis sheds light on unique details of the structure and dynamics which are helpful in understanding the multiple roles and physiological functions of these proteins during fatty synthesis and other metabolic processes. Finally, the high-resolution structures of these Gram-negative bacterial proteins can facilitate the application of rational structure-based approaches for the development of novel antibiotics targeting these essential proteins (61).
Supplementary Material
Figure S1: Residues with R2 values >7.5 sec−1 cluster near the ligand binding residue. The residues with these high R2 values are shown in orange color, whereas the ligan-binding site is shown with orange spheres.
Figure S2: Residues with fast internal motions map near the ligand-binding residue (400-7,000 ns) are shown with orange color. The ligand-binding site is identified with orange spheres.
Figure S3: Residues with Rex map near the ligand-binding residue. Residues with Rex values (>1.0 sec−1) are shown with orange color whereas the ligand-binding site is shown with orange spheres.
Acknowledgement
We acknowledge members from the SSGCID and the Varani laboratory for the continuous support during this project. This research was funded under the Federal Contract No. HHSN272200700057C from the National Institute of Allergy and Infectious Diseases, The National Institutes of Health, Department of Health and Human Services. RPB acknowledges UGC-faculty recharge program and DST-ECR/2017/000124 for funding utilized for this project in India.
Abbreviations:
- FAS
fatty acid synthase
- CoA
Coenzyme A
- PPT
phosphopantetheinyl transferase
- BoACP
acyl carrier protein form Borrelia burgdorferi
- BrACP
acyl carrier protein form Brucella melitensis
- RiACP
acyl carrier protein form Rickettsia prowazekii
Footnotes
Conflict of Interest: The authors declare no conflict of interest associated with the current manuscript.
References:
- 1.Nguyen C, Haushalter RW, Lee DJ, Markwick PR, Bruegger J, Caldara-Festin G, et al. Trapping the dynamic acyl carrier protein in fatty acid biosynthesis. Nature. 2014;505(7483):427–31. [DOI] [PMC free article] [PubMed] [Google Scholar]
- 2.Masoudi A, Raetz CR, Zhou P, Pemble CWt. Chasing acyl carrier protein through a catalytic cycle of lipid A production. Nature. 2014;505(7483):422–6. [DOI] [PMC free article] [PubMed] [Google Scholar]
- 3.Leibundgut M, Jenni S, Frick C, Ban N. Structural basis for substrate delivery by acyl carrier protein in the yeast fatty acid synthase. Science (New York, NY. 2007;316(5822):288–90. [DOI] [PubMed] [Google Scholar]
- 4.Maier T, Leibundgut M, Ban N. The crystal structure of a mammalian fatty acid synthase. Science (New York, NY. 2008;321(5894):1315–22. [DOI] [PubMed] [Google Scholar]
- 5.Maier T, Leibundgut M, Boehringer D, Ban N. Structure and function of eukaryotic fatty acid synthases. Quarterly reviews of biophysics. 2010;43(3):373–422. [DOI] [PubMed] [Google Scholar]
- 6.Leibundgut M, Maier T, Jenni S, Ban N. The multienzyme architecture of eukaryotic fatty acid synthases. Current opinion in structural biology. 2008;18(6):714–25. [DOI] [PubMed] [Google Scholar]
- 7.Maier T, Jenni S, Ban N. Architecture of mammalian fatty acid synthase at 4.5 A resolution. Science (New York, NY. 2006;311(5765):1258–62. [DOI] [PubMed] [Google Scholar]
- 8.Whicher JR, Dutta S, Hansen DA, Hale WA, Chemler JA, Dosey AM, et al. Structural rearrangements of a polyketide synthase module during its catalytic cycle. Nature. 2014;510(7506):560–4. [DOI] [PMC free article] [PubMed] [Google Scholar]
- 9.Byers DM, Gong H. Acyl carrier protein: structure-function relationships in a conserved multifunctional protein family. Biochemistry and cell biology = Biochimie et biologie cellulaire. 2007;85(6):649–62. [DOI] [PubMed] [Google Scholar]
- 10.Kleinkauf H The role of 4′-phosphopantetheine in t’ biosynthesis of fatty acids, polyketides and peptides. BioFactors. 2000;11(1-2):91–2. [DOI] [PubMed] [Google Scholar]
- 11.Strickland KC, Hoeferlin LA, Oleinik NV, Krupenko NI, Krupenko SA. Acyl carrier protein-specific 4′-phosphopantetheinyl transferase activates 10-formyltetrahydrofolate dehydrogenase. The Journal of biological chemistry. 2010;285(3):1627–33. [DOI] [PMC free article] [PubMed] [Google Scholar]
- 12.McAllister KA, Peery RB, Zhao G. Acyl carrier protein synthases from gram-negative, gram-positive, and atypical bacterial species: Biochemical and structural properties and physiological implications. Journal of bacteriology. 2006;188(13):4737–48. [DOI] [PMC free article] [PubMed] [Google Scholar]
- 13.Haines AS, Dong X, Song Z, Farmer R, Williams C, Hothersall J, et al. A conserved motif flags acyl carrier proteins for beta-branching in polyketide synthesis. Nature chemical biology. 2013;9(11):685–92. [DOI] [PMC free article] [PubMed] [Google Scholar]
- 14.Ramelot TA, Rossi P, Forouhar F, Lee HW, Yang Y, Ni S, et al. Structure of a specialized acyl carrier protein essential for lipid A biosynthesis with very long-chain fatty acids in open and closed conformations. Biochemistry. 2012;51(37):7239–49. [DOI] [PMC free article] [PubMed] [Google Scholar]
- 15.Chan DI, Vogel HJ. Current understanding of fatty acid biosynthesis and the acyl carrier protein. Biochem J. 2010;430(1):1–19. [DOI] [PubMed] [Google Scholar]
- 16.Zhou Z, Lai JR, Walsh CT. Directed evolution of aryl carrier proteins in the enterobactin synthetase. Proceedings of the National Academy of Sciences of the United States of America. 2007;104(28):11621–6. [DOI] [PMC free article] [PubMed] [Google Scholar]
- 17.Lai JR, Fischbach MA, Liu DR, Walsh CT. A protein interaction surface in nonribosomal peptide synthesis mapped by combinatorial mutagenesis and selection. Proceedings of the National Academy of Sciences of the United States of America. 2006;103(14):5314–9. [DOI] [PMC free article] [PubMed] [Google Scholar]
- 18.Tanovic A, Samel SA, Essen LO, Marahiel MA. Crystal structure of the termination module of a nonribosomal peptide synthetase. Science (New York, NY. 2008;321(5889):659–63. [DOI] [PubMed] [Google Scholar]
- 19.Fraser CM, Casjens S, Huang WM, Sutton GG, Clayton R, Lathigra R, et al. Genomic sequence of a Lyme disease spirochaete, Borrelia burgdorferi. Nature. 1997;390(6660):580–6. [DOI] [PubMed] [Google Scholar]
- 20.Chain PS, Comerci DJ, Tolmasky ME, Larimer FW, Malfatti SA, Vergez LM, et al. Whole-genome analyses of speciation events in pathogenic Brucellae. Infection and immunity. 2005;73(12):8353–61. [DOI] [PMC free article] [PubMed] [Google Scholar]
- 21.Andersson SG, Zomorodipour A, Andersson JO, Sicheritz-Ponten T, Alsmark UC, Podowski RM, et al. The genome sequence of Rickettsia prowazekii and the origin of mitochondria. Nature. 1998;396(6707):133–40. [DOI] [PubMed] [Google Scholar]
- 22.Massung RF, Davis LE, Slater K, McKechnie DB, Puerzer M. Epidemic typhus meningitis in the southwestern United States. Clinical infectious diseases : an official publication of the Infectious Diseases Society of America. 2001;32(6):979–82. [DOI] [PubMed] [Google Scholar]
- 23.Gray MW. Rickettsia, typhus and the mitochondrial connection. Nature. 1998;396(6707):109–10. [DOI] [PubMed] [Google Scholar]
- 24.Barnwal RP, Rout AK, Chary KV, Atreya HS. Rapid measurement of 3J(H N-H alpha) and 3J(N-H beta) coupling constants in polypeptides. Journal of biomolecular NMR. 2007;39(4):259–63. [DOI] [PubMed] [Google Scholar]
- 25.Barnwal RPR AK; Chary KVR, Atreya HS Rapid measurement of pseudocontact shifts in paramagnetic proteins by GFT NMR spectroscopy. Open Magn Reson J. 2008;1:13. [Google Scholar]
- 26.Cavanagh J, Fairbrother WJ, Palmer AG, Skelton NJ, Rance M Protein NMR spectroscopy: Principles and practice. 2nd ed: Academic Press; 2006. [Google Scholar]
- 27.Delaglio F, Grzesiek S, Vuister GW, Zhu G, Pfeifer J, Bax A. NMRPipe: a multidimensional spectral processing system based on UNIX pipes. Journal of biomolecular NMR. 1995;6(3):277–93. [DOI] [PubMed] [Google Scholar]
- 28.Vranken WF, Boucher W, Stevens TJ, Fogh RH, Pajon A, Llinas M, et al. The CCPN data model for NMR spectroscopy: development of a software pipeline. Proteins. 2005;59(4):687–96. [DOI] [PubMed] [Google Scholar]
- 29.Guntert P Automated NMR structure calculation with CYANA. Methods Mol Biol. 2004;278:353–78. [DOI] [PubMed] [Google Scholar]
- 30.Shen Y, Delaglio F, Cornilescu G, Bax A. TALOS+: a hybrid method for predicting protein backbone torsion angles from NMR chemical shifts. Journal of biomolecular NMR. 2009;44(4):213–23. [DOI] [PMC free article] [PubMed] [Google Scholar]
- 31.Koradi R, Billeter M, Wuthrich K. MOLMOL: a program for display and analysis of macromolecular structures. JMolGraph. 1996;14(1):51–32. [DOI] [PubMed] [Google Scholar]
- 32.Laskowski RA, Rullmannn JA, MacArthur MW, Kaptein R, Thornton JM. AQUA and PROCHECK-NMR: programs for checking the quality of protein structures solved by NMR. J Biomol NMR. 1996;8(4):477–86. [DOI] [PubMed] [Google Scholar]
- 33.Bhattacharya A, Tejero R, Montelione GT. Evaluating protein structures determined by structural genomics consortia. Proteins. 2007;66(4):778–95. [DOI] [PubMed] [Google Scholar]
- 34.Kay LE, Torchia DA, Bax A. Backbone dynamics of proteins as studied by 15N inverse detected heteronuclear NMR spectroscopy: application to staphylococcal nuclease. Biochemistry. 1989;28(23):8972–9. [DOI] [PubMed] [Google Scholar]
- 35.Skelton NJ, Kordel J, Akke M, Chazin WJ. Nuclear magnetic resonance studies of the internal dynamics in Apo, (Cd2+)1 and (Ca2+)2 calbindin D9k. The rates of amide proton exchange with solvent. JMolBiol. 1992;227(4):1100–17. [DOI] [PubMed] [Google Scholar]
- 36.Bieri M, d’Auvergne EJ, Gooley PR. relaxGUI: a new software for fast and simple NMR relaxation data analysis and calculation of ps-ns and mus motion of proteins. J Biomol NMR. 2011;50(2):147–55. [DOI] [PubMed] [Google Scholar]
- 37.d’Auvergne EJ, Gooley PR. The use of model selection in the model-free analysis of protein dynamics. J Biomol NMR. 2003;25(1):25–39. [DOI] [PubMed] [Google Scholar]
- 38.Greenfield NJ. Analysis of circular dichroism data. Methods in enzymology. 2004;383:282–317. [DOI] [PubMed] [Google Scholar]
- 39.Greenfield NJ. Analysis of the kinetics of folding of proteins and peptides using circular dichroism. Nat Protoc. 2006;1(6):2891–9. [DOI] [PMC free article] [PubMed] [Google Scholar]
- 40.Greenfield NJ. Determination of the folding of proteins as a function of denaturants, osmolytes or ligands using circular dichroism. Nature protocols. 2006;1(6):2733–41. [DOI] [PMC free article] [PubMed] [Google Scholar]
- 41.Barnwal RP, Jobby MK, Devi KM, Sharma Y, Chary KV. Solution structure and calcium-binding properties of M-crystallin, a primordial betagamma-crystallin from archaea. Journal of molecular biology. 2009;386(3):675–89. [DOI] [PubMed] [Google Scholar]
- 42.Greenfield NJ. Using circular dichroism collected as a function of temperature to determine the thermodynamics of protein unfolding and binding interactions. Nature protocols. 2006;1(6):2527–35. [DOI] [PMC free article] [PubMed] [Google Scholar]
- 43.Greenfield NJ. Using circular dichroism spectra to estimate protein secondary structure. Nat Protoc. 2006;1(6):2876–90. [DOI] [PMC free article] [PubMed] [Google Scholar]
- 44.Barnwal RP, Agarwal G, Chary KV. Guanidine-HCl dependent structural unfolding of M-crystallin: fluctuating native state like topologies and intermolecular association. PLoS One. 2012;7(12):e42948. [DOI] [PMC free article] [PubMed] [Google Scholar]
- 45.Kumar S, Stecher G, Li M, Knyaz C, Tamura K. MEGA X: Molecular Evolutionary Genetics Analysis across Computing Platforms. Molecular biology and evolution. 2018;35(6):1547–9. [DOI] [PMC free article] [PubMed] [Google Scholar]
- 46.Madeira F, Park YM, Lee J, Buso N, Gur T, Madhusoodanan N, et al. The EMBL-EBI search and sequence analysis tools APIs in 2019. Nucleic acids research. 2019;47(W1):W636–W41. [DOI] [PMC free article] [PubMed] [Google Scholar]
- 47.Powell GL, Bauza M, Larrabee AR. The stability of acyl carrier protein in Escherichia coli. The Journal of biological chemistry. 1973;248(12):4461–6. [PubMed] [Google Scholar]
- 48.Barnwal RP, Van Voorhis WC, Varani G. NMR structure of an acyl-carrier protein from Borrelia burgdorferi. Acta Crystallogr Sect F Struct Biol Cryst Commun. 2011;67(Pt 9):1137–40. [DOI] [PMC free article] [PubMed] [Google Scholar]
- 49.Mayo KH, Prestegard JH. Acyl carrier protein from Escherichia coli. Structural characterization of short-chain acylated acyl carrier proteins by NMR. Biochemistry. 1985;24(26):7834–8. [DOI] [PubMed] [Google Scholar]
- 50.Jones PJ, Cioffi EA, Prestegard JH. [19F]-1H heteronuclear nuclear Overhauser effect studies of the acyl chain-binding site of acyl carrier protein. The Journal of biological chemistry. 1987;262(19):8963–5. [PubMed] [Google Scholar]
- 51.d’Auvergne EJ, Gooley PR. Model-free model elimination: a new step in the model-free dynamic analysis of NMR relaxation data. J Biomol NMR. 2006;35(2):117–35. [DOI] [PubMed] [Google Scholar]
- 52.Clore GM, Szabo A, Bax A, Kay LE, Driscoll PC, Gronenborn AM. Deviations from the simple 2-parameter model-free approach to the interpretation of N-15 nuclear magnetic-relaxation of proteins. J Am Chem Soc. 1990;112(12):4989–91. [Google Scholar]
- 53.Palmer AG, Rance M, Wright PE. Intramolecular Motions of a Zinc Finger DNA-Binding Domain from Xfin Characterized by Proton-Detected Natural Abundance C-12 Heteronuclear Nmr-Spectroscopy. J Am Chem Soc. 1991;113(12):4371–80. [Google Scholar]
- 54.Mandel AM, Akke M, Palmer AG 3rd. Backbone dynamics of Escherichia coli ribonuclease HI: correlations with structure and function in an active enzyme. Journal of molecular biology. 1995;246(1):144–63. [DOI] [PubMed] [Google Scholar]
- 55.Lipari G, Szabo A. Model-Free Approach to the Interpretation of Nuclear Magnetic-Resonance Relaxation in Macromolecules .1. Theory and Range of Validity. J Am Chem Soc. 1982;104(17):4546–59. [Google Scholar]
- 56.Lipari G, Szabo A. Model-Free Approach to the Interpretation of Nuclear Magnetic-Resonance Relaxation in Macromolecules .2. Analysis of Experimental Results. J Am Chem Soc. 1982;104(17):4559–70. [Google Scholar]
- 57.Lee LK, Rance M, Chazin WJ, Palmer AG. Rotational diffusion anisotropy of proteins from simultaneous analysis of N-15 and C-13(alpha) nuclear spin relaxation. Journal of biomolecular NMR. 1997;9(3):287–98. [DOI] [PubMed] [Google Scholar]
- 58.Tjandra N, Feller SE, Pastor RW, Bax A. Rotational diffusion anisotropy of human ubiquitin from N-15 NMR relaxation. J Am Chem Soc. 1995;117(50):12562–6. [Google Scholar]
- 59.Farrow NA, Muhandiram R, Singer AU, Pascal SM, Kay CM, Gish G, et al. Backbone dynamics of a free and phosphopeptide-complexed Src homology 2 domain studied by 15N NMR relaxation. Biochemistry. 1994;33(19):5984–6003. [DOI] [PubMed] [Google Scholar]
- 60.Magnarelli LA, Swihart RK. Spotted fever group rickettsiae or Borrelia burgdorferi in Ixodes cookei (Ixodidae) in Connecticut. Journal of clinical microbiology. 1991;29(7):1520–2. [DOI] [PMC free article] [PubMed] [Google Scholar]
- 61.White SW, Zheng J, Zhang YM, Rock. The structural biology of type II fatty acid biosynthesis. Annual review of biochemistry. 2005;74:791–831. [DOI] [PubMed] [Google Scholar]
- 62.Li W, Cowley A, Uludag M, Gur T, McWilliam H, Squizzato S, et al. The EMBL-EBI bioinformatics web and programmatic tools framework. Nucleic acids research. 2015. [DOI] [PMC free article] [PubMed] [Google Scholar]
- 63.Robert X, Gouet P. Deciphering key features in protein structures with the new ENDscript server. Nucleic acids research. 2014;42(Web Server issue):W320–4. [DOI] [PMC free article] [PubMed] [Google Scholar]
- 64.Crooks GE, Hon G, Chandonia JM, Brenner SE. WebLogo: A sequence logo generator. Genome Research. 2004;14(6):1188–90. [DOI] [PMC free article] [PubMed] [Google Scholar]
Associated Data
This section collects any data citations, data availability statements, or supplementary materials included in this article.
Supplementary Materials
Figure S1: Residues with R2 values >7.5 sec−1 cluster near the ligand binding residue. The residues with these high R2 values are shown in orange color, whereas the ligan-binding site is shown with orange spheres.
Figure S2: Residues with fast internal motions map near the ligand-binding residue (400-7,000 ns) are shown with orange color. The ligand-binding site is identified with orange spheres.
Figure S3: Residues with Rex map near the ligand-binding residue. Residues with Rex values (>1.0 sec−1) are shown with orange color whereas the ligand-binding site is shown with orange spheres.