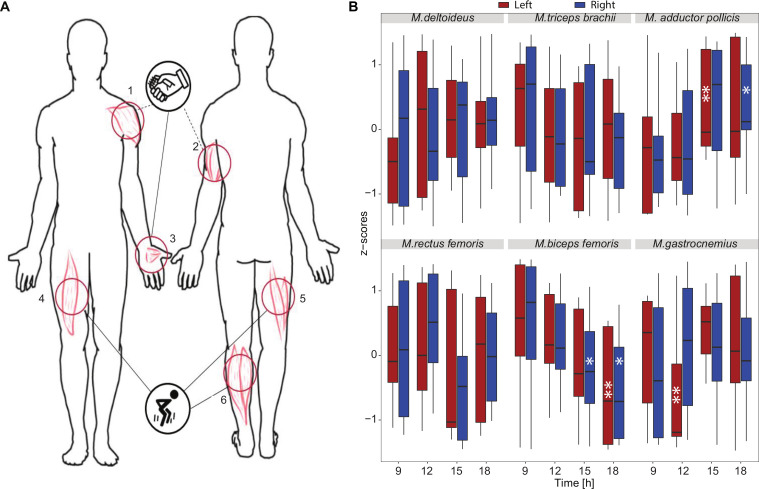
Figure 5.
Myotonometric analysis shows daily variation in resting muscle tone (frequency, F). (A) Schematic representation of skin measurement points (MP) at the arms, hands and legs. MP1—M. deltoideus, MP2—M. triceps brachii, MP3—M. adductor pollicis, (activated mainly during HST), MP4—M. rectus femoris, MP5—M. biceps femoris, MP6—M. gastrocnemius (activated mainly during CMJ). Only participants who completed all exercise sessions were included in the myotonometric analysis (n=11). (B) Z-scores for the myotonometric parameter frequency (Hz) for each exercise session (9h, 12h, 15h, 18h) and each muscle (M. deltoidus, M. triceps brachii, M.adductor pollicis, M. rectus femoris, M. biceps femoris, M. gastrocnemius, respectively). The measurements were carried out from top to bottom on the right (R—blue line) and the corresponding left (L—red line) side of the body. A gender-based analysis is presented in online supplemental figure 5. Significance is provided relative to the first time point (9h), the median value is indicated. *p<0.05, **p<0.01, ***p<0.001; Friedman test. CMJ, counter-movement-jump; HST, hand-strength-test.

