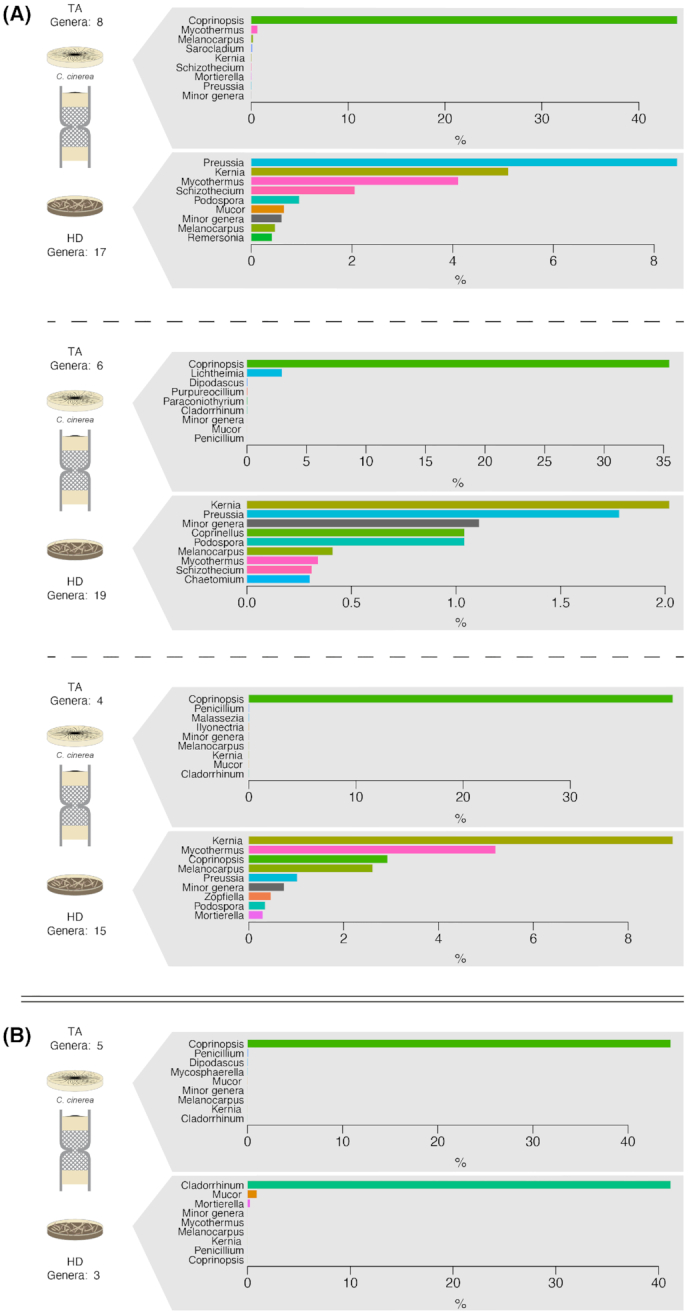
Figure 4.

Fungal community analysis based on the sequencing of ITS comparing the communities in horse dung and the target medium. The treatment corresponds to columns in which C. cinerea was pre-inoculated in the target medium. Each plot represents the comparison in the relative abundance of the most dominant fungal genera in horse dung (bottom) and target medium (up) per column replicate. The analysis corresponded to DNA extractions of the total community (A; three replicates) or of the culturable community (B; one replicate). To increase readability, the relative abundance of the eight most abundant genera is shown, and other genera were grouped in a ‘Minor genera’ category. A complete representation of the community composition is shown in Fig. S2 (Supporting Information).
