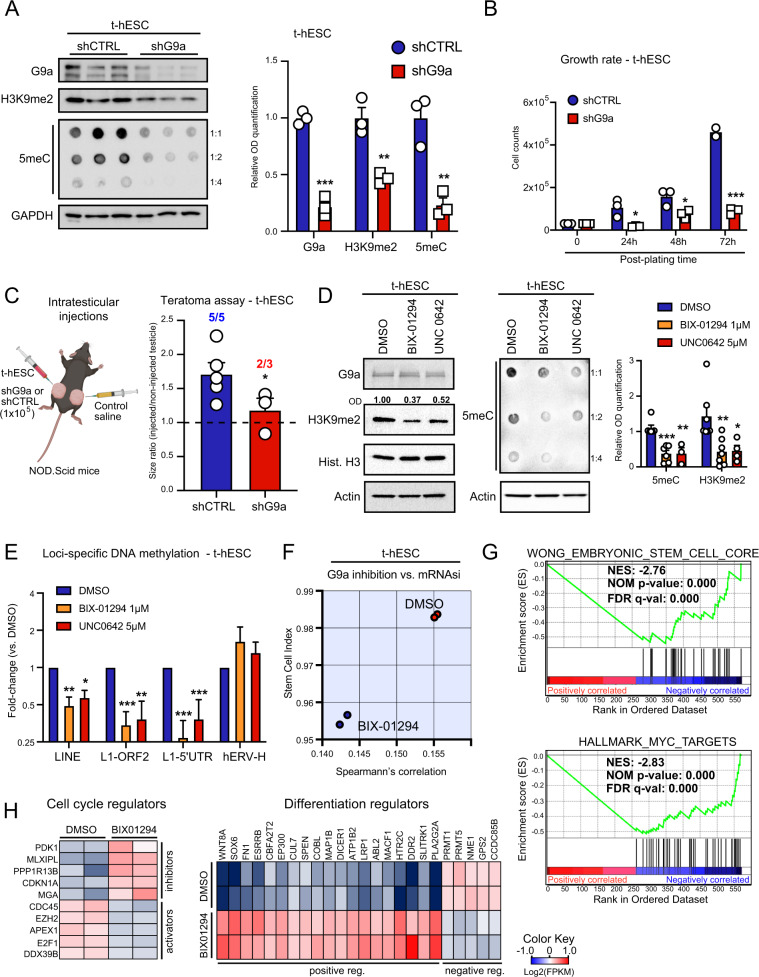
Fig. 2. Suppression of G9a activity reduces pluripotent identity and tumor growth capacity in transformed human embryonic stem cells (t-hESCs).
A Western blot analysis of G9a, H3K9me2, and dot blot analysis of 5-methylcytosine (5meC: methylated DNA) levels in G9a knockdown t-hESCs vs. scramble control shRNA (shCTRL). GAPDH was used as loading control. Relative OD signal quantification vs. GAPDH intensity are presented (n = 3, ***: p = 0.0001; **: p ≤ 0.0057). B Growth rate assessment of shG9a vs. shCTRL t-hESC cultures. Cell counts were acquired at 24 h (*: p = 0.021), 48 h (*: p = 0.034), and 72 h (***: p = 0.0003) post-seeding (30 K cells/well, n = 3). C Testicular teratoma assay using shCTRL (n = 5) and shG9a (n = 3) t-hESCs over 14 days. 1 × 10⁵ cells (left testicle) or saline (right testicle) were injected in each mouse. Tumor formation frequencies and tumor/control size ratios were presented for both groups (*: p = 0.043). D Western blot analysis of H3K9me2 and dot blot analysis of 5 meC levels upon pharmacological inhibition of G9a HMTase activity (BIX-01294: 1 μM, UNC0642: 5 μM, 48 h) in t-hESCs (H3K9me2: n ≥ 4, **: p = 0.0067; *: p = 0.031; 5 meC: n ≥ 3, ***: p = 0.00057; **: p = 0.0083). E Methylated DNA immunoprecipitation (MeDIP) assay showing variations of methylation levels in t-hESCs LINE transposable elements upon BIX-01294 (1 μM) and UNC0642 (5 μM) treatments, relative to DMSO controls (total LINEs: n = 3, **: 0.0082; *: p = 0.013; LINE-1 ORF2: n = 5, ***: p = 0.0004; **: p = 0.0072; LINE-1 5′-UTR: n = 6, ***: p ≤ 0.00089). Methylation of endogenous retroviral elements hERV-H was not affected by G9a inhibition (n = 6). F mRNAsi from RNA-seq transcriptome profiling was determined for BIX-01294 (1 μM) and DMSO treated t-hESCs. G GSEA revealed negative correlations between significant transcriptional modulations induced by BIX-01294 in t-hESCs (vs. DMSO, p < 0.05) and genes upregulated in embryonic stem cell, as well as genes induced by MYC. H Heat maps representing expression of significantly modulated genes (p < 0.05) associated with cell cycle (Negative Reg.: GO:0045786, Positive Reg.: GO:0045787) and differentiation regulation (Positive Reg./Stem Cell Diff.: GO:0045597, GO:0048863, Negative Reg.: GO:0045596) in BIX-01294-treated t-hESCs vs. DMSO controls.

