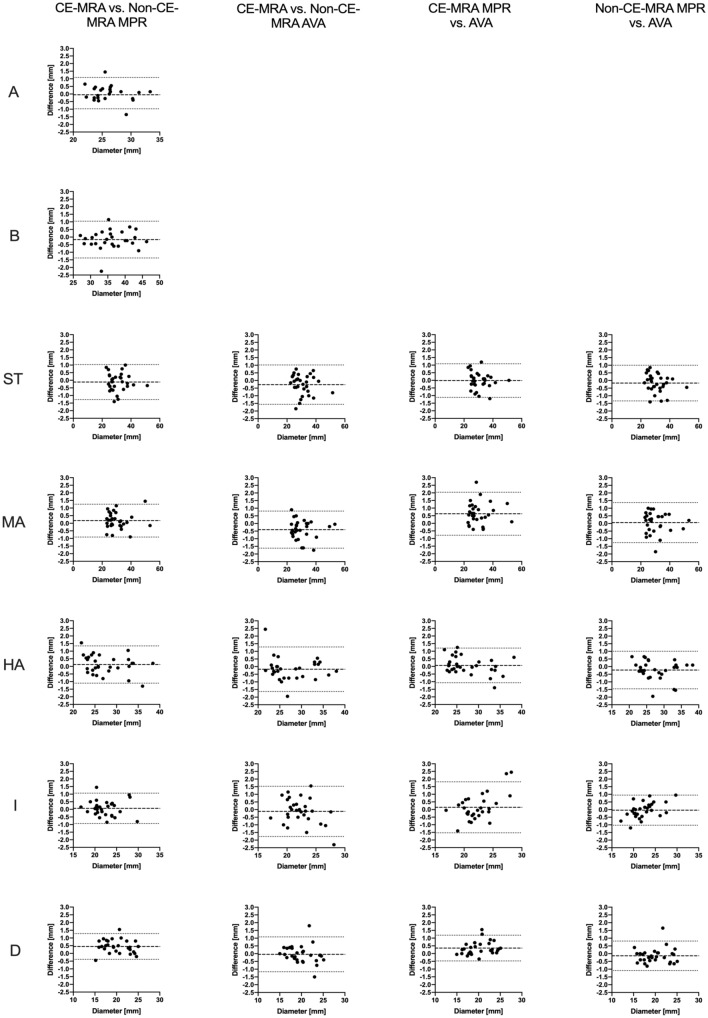
Fig. 4.
Bland–Altman comparison of measured diameters of the thoracic aorta at the seven levels of measurement (A aortic annulus, B aortic sinus, ST sinotubular junction, MA mid-ascending aorta, HA high-ascending aorta, I aortic isthmus, D descending aorta) for the different methods of imaging and measurement. The middle lines represent the mean absolute difference of measurements, the outer boundaries the 95% confidence interval. Due to known recurrent measurement errors of the AVA-tool, measurements at aortic annulus and sinus were excluded

