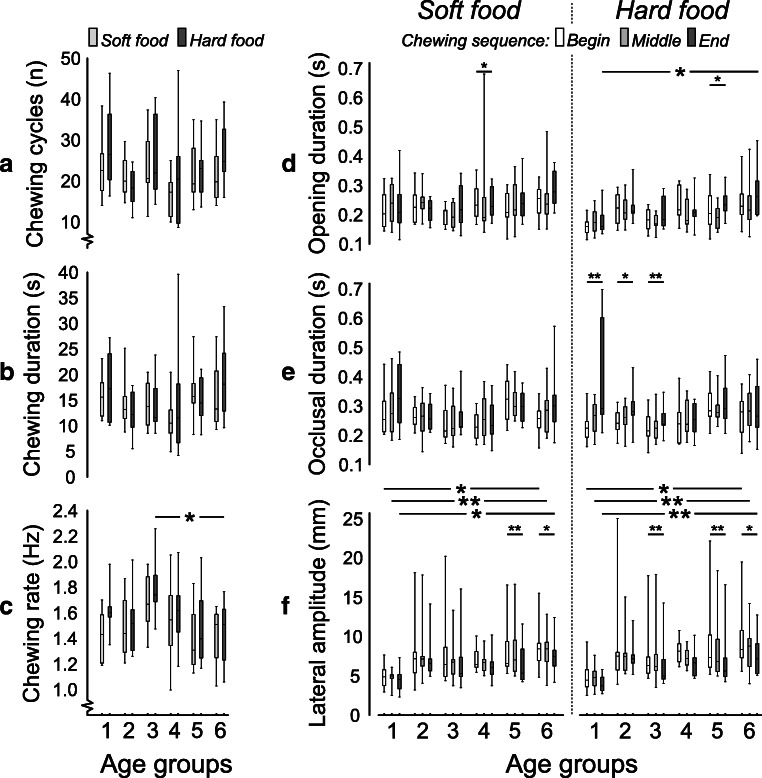
Fig. 2.
Box plots of the number of chewing cycles (a), chewing sequence duration (b), chewing rate (c), jaw-opening duration (d), occlusal duration (e), and lateral jaw movement amplitude (f) for the soft and hard viscoelastic test food models performed by each of the six age-groups: primary (1), early-mixed (2), late-mixed (3), early-permanent (4), and late-permanent (5) dentition groups and adults (6). Significant results of between-group differences were denoted (* = p ˂ 0.05; ** = p ˂ 0.01; *** = p ˂ 0.001)

