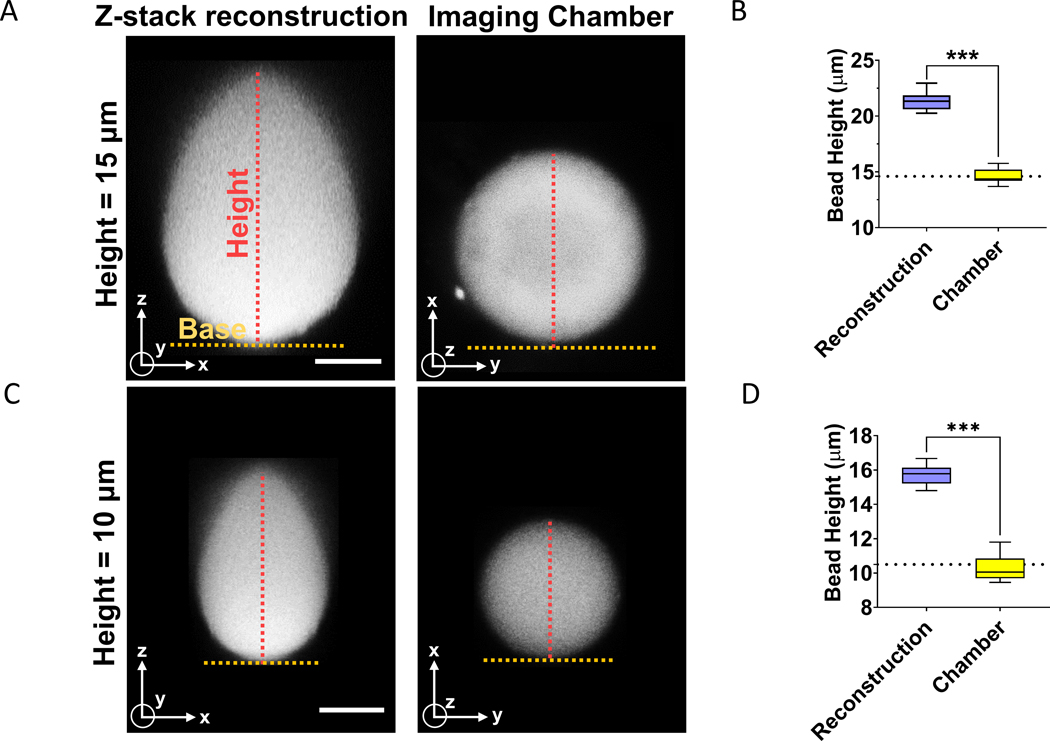
Figure 2. Comparison of x-z shapes reconstructed from confocal sectioning, and corresponding x-y shapes acquired in the orthogonal imaging chamber.
(A) Image of x-z cross-section of fluorescent bead (diameter = 15 μm) reconstructed from confocal z-stacks and acquired with the imaging chamber. Scale bar is 5 μm. (B) The graph shows a quantitative comparison of diameter of beads (d = 15 μm) corresponding to the two imaging methods in (A). Dotted line represents manufacturer’s specification for the mean diameter of the bead. The experiments were performed in triplicates and 20 beads were quantified. “***” signifies statistically significant difference (p < 0.05 by student’s t-test). (C) Image shows x-z cross-section of fluorescent bead (diameter = 10 μm) reconstructed from confocal z-stacks and a single x-y image acquired with the orthogonal imaging chamber. Scale bar is 5 μm. (D) Graph shows a comparison of diameter of beads (d = 10 μm) corresponding to the two imaging methods in (C). Dotted line represents manufacturer’s specification for the mean diameter of the bead. The experiments were performed in triplicates and 20 beads were quantified. “***” signifies statistically significant difference (p < 0.05 by student’s t-test).

