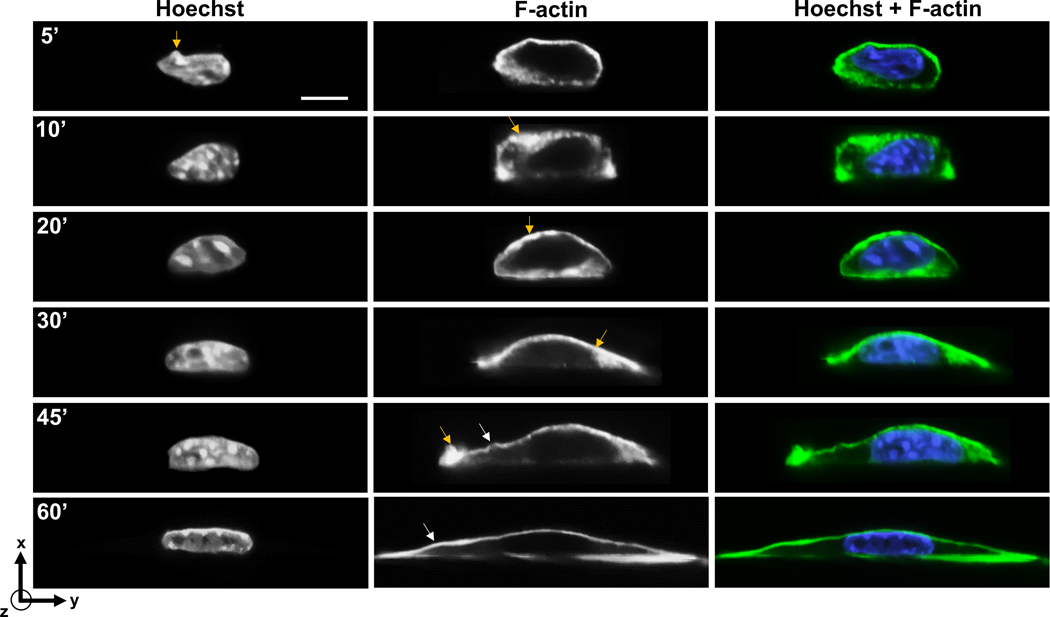
Figure 4. X-y imaging of cells fixed at different time points after seeding on to a glass coverslip in the orthogonal imaging chamber.
Chromatin was stained with Hoechst (H33342) and F-actin was stained with phalloidin. Yellow arrows mark local spots of F-actin enrichment, and local nuclear irregularity in image at 5’. White arrowheads mark spatial variations in curvature of apical F-actin. Scale bar is 5 μm.

