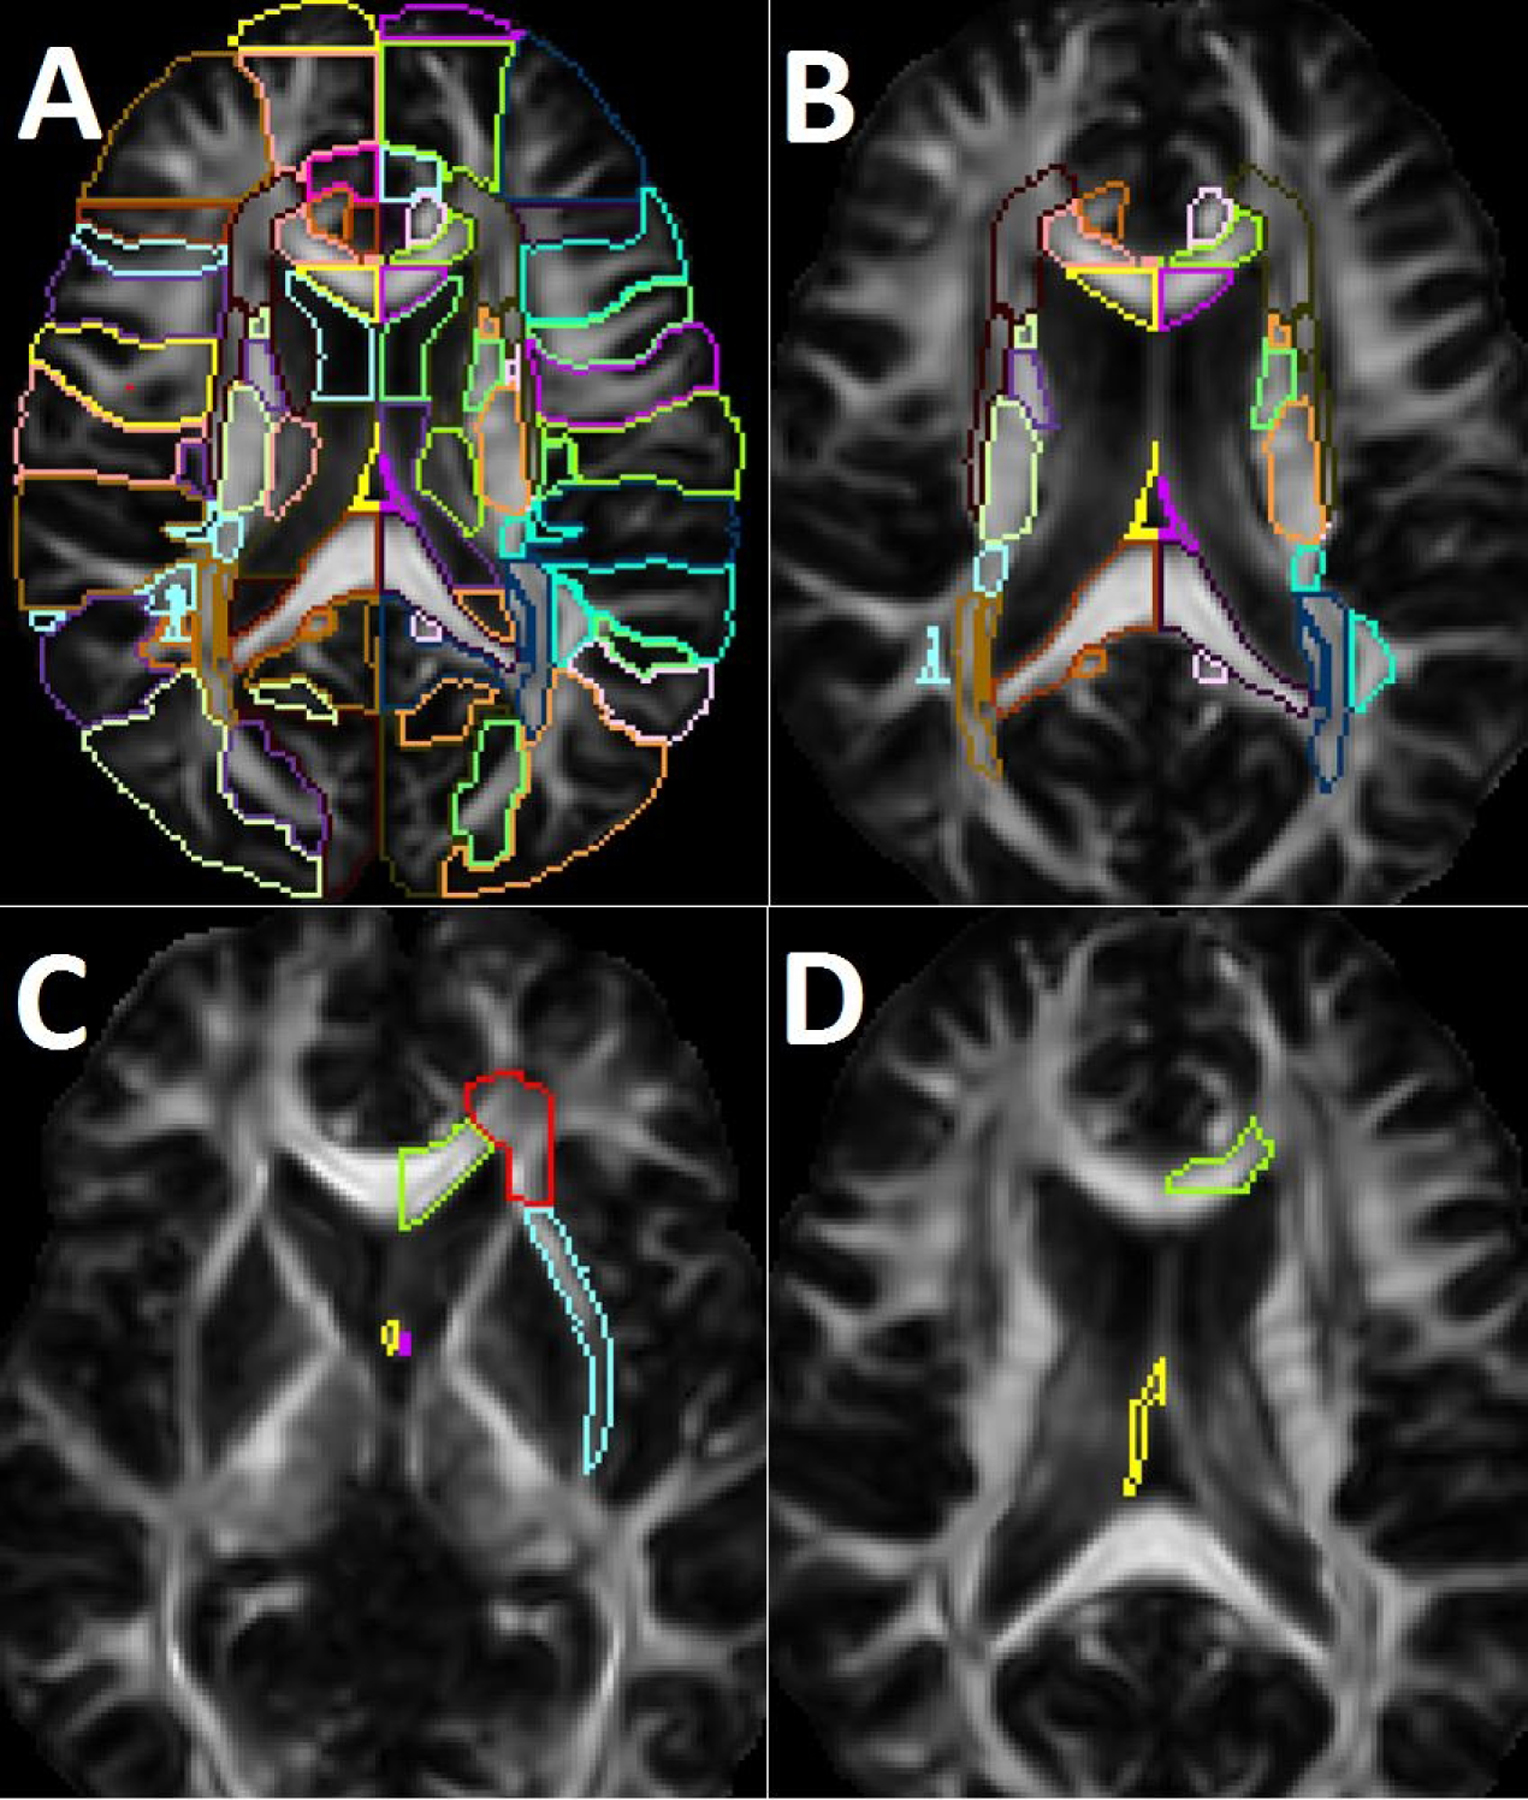
Figure 1A.

shows segmentation of the white matter regions into 181 atlas areas. Figure 1B shows the selected 48 regions representing the subcortical white matter areas of interest. Figure 1C shows white matter areas that were found to be associated with worse performance on the grooved peg board test in the whole cohort (green: left genu of the corpus callosum; red: left anterior corona radiate; blue: left external capsule; yellow: right fornix; purple: left fornix). In the sensitivity analysis, right fornix (yellow) and left external capsule (blue) were only significant. Figure 1D shows areas that were associated with elevated serum ceramide levels in the whole cohort and sensitivity analysis (yellow: right fornix; green: left genu of the corpus callosum).
