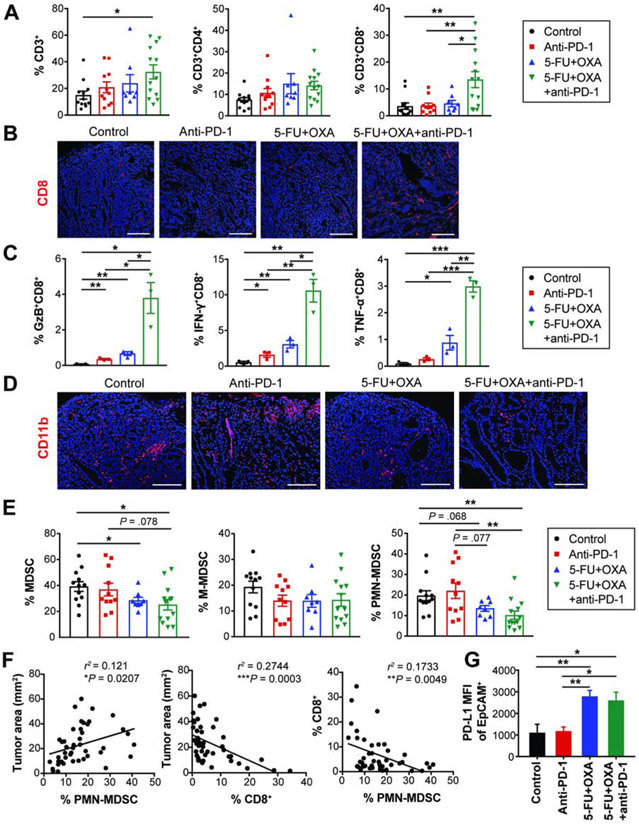
Figure 4. Immune effects of combination chemo-immunotherapy.
(A) The proportion of intratumoral T cells in treated GAS-KO tumors (n = 8-13/group).
(B) CD8 immunostaining on treated tumors.
(C) Frequency of effector cytokine-secreting CD8+ T cells (n = 3/group).
(D) CD11b immunostaining on treated tumors.
(E) The proportion of MDSCs in treated GAS-KO tumors (n = 8-13/group).
(F) Linear regression analyses between tumor area and the percentage of CD8+ T cells and PMN-MDSCs in GAS-KO tumors (n = 44). r2 and P-values are shown.
(G) MFI (mean fluorescence intensity) of PD-L1 expressed on EpCAM+ cells isolated from GAS-KO tumors treated as indicated (n = 3-5/group).
Scale bars, 50 μm. Mean ± SEM. Student’s t-test. *P < .05; **P < .01; ***P < .001.

