
FIGURE 1: HGSC organoid co-cultures accurately mimic the parent tumors from which they were derived:
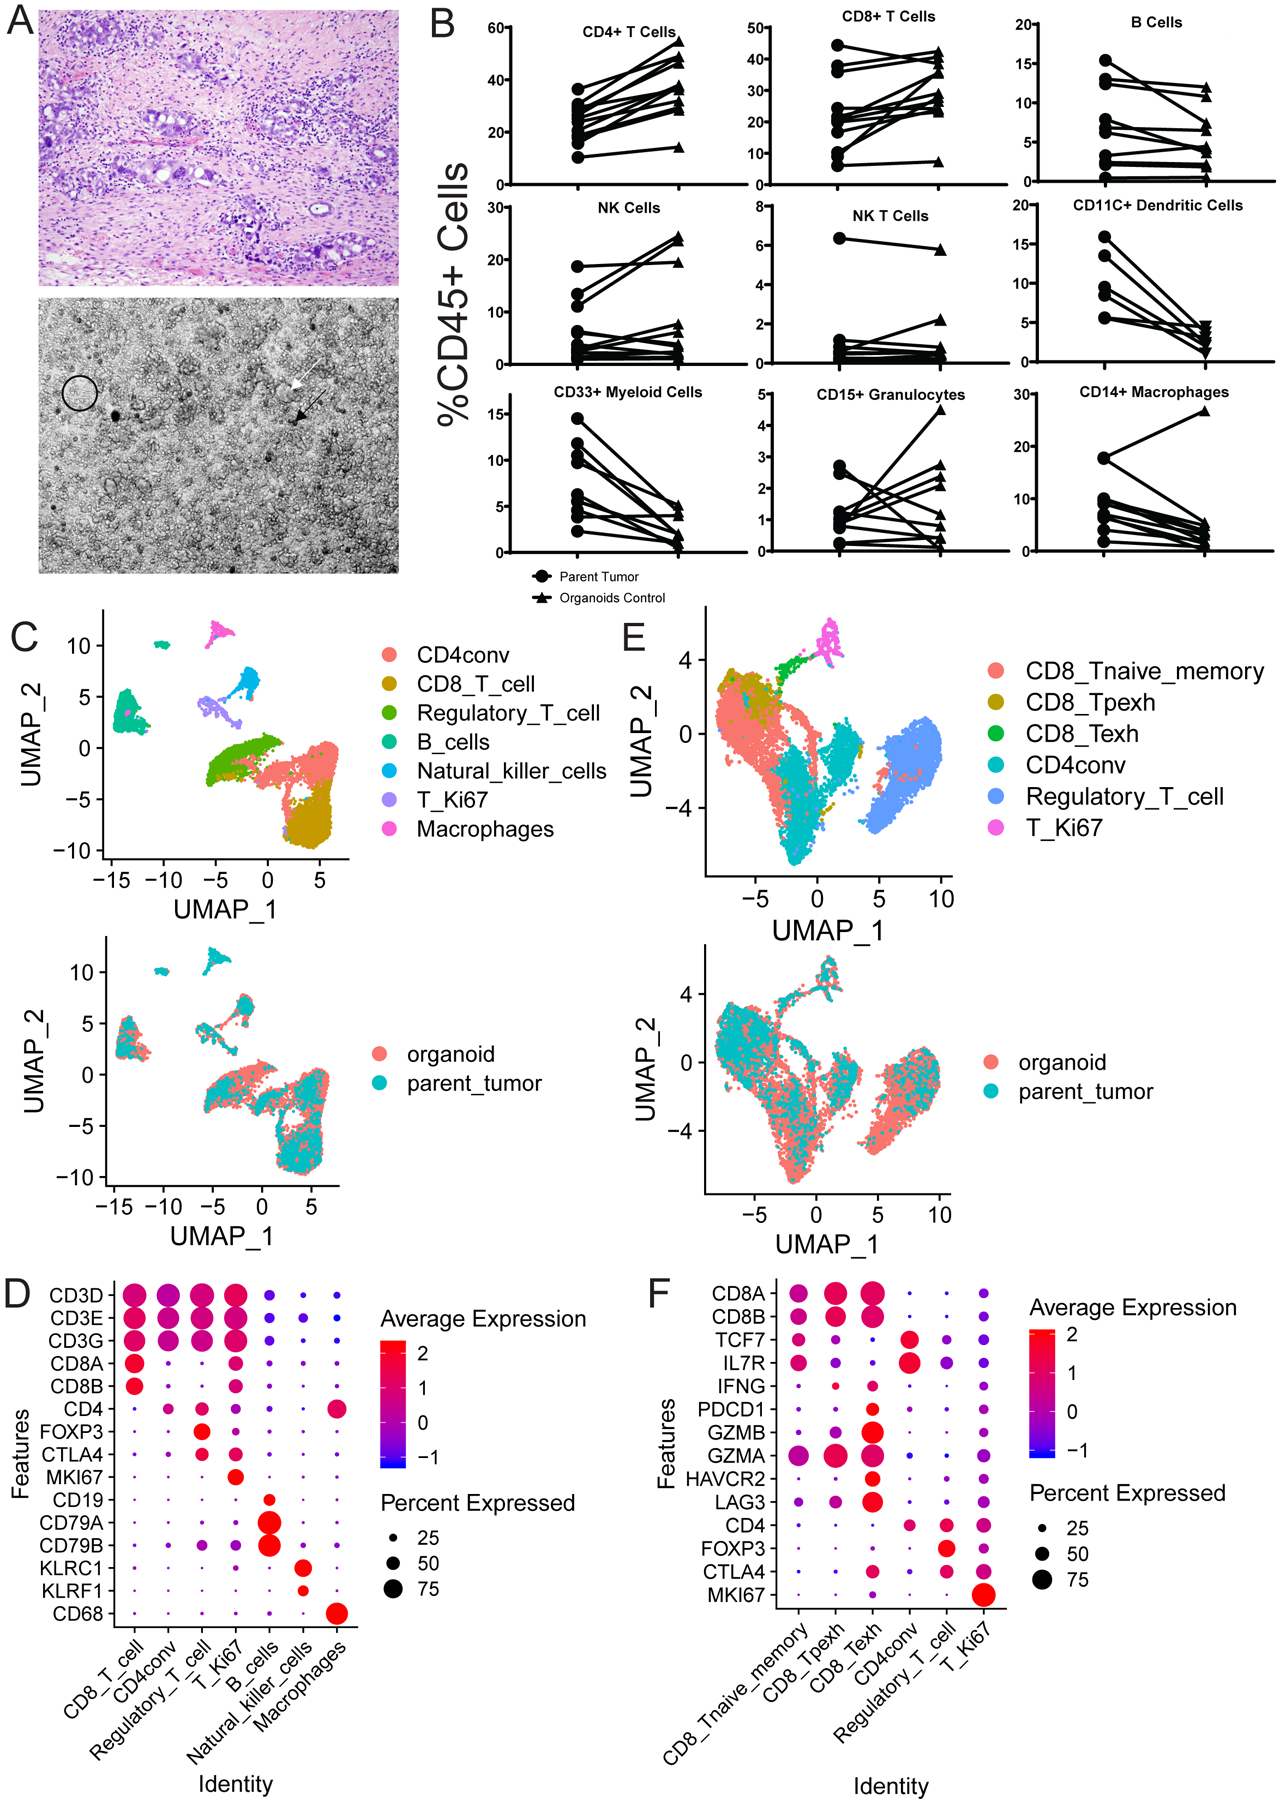
A) Organoid co-cultures (bottom) physically resemble the diverse cellular environment of the parent tumor (top) which includes cancer, stromal, and immune cells. The co-cultures contain tumor spheres (white arrow), clusters of single immune and stromal cells (black circle), and psammoma body calcifications (black arrow). B) Flow cytometry analysis for all immune cell types was performed on parent tumors and control treated organoids. Comparisons of each individual immune cell type between parent tumor (circles) and control treated organoid co-culture (triangles) as a percentage of viable CD45 positive cells are shown. C-F) scRNA-seq analysis results comparing the parent tumor and treated organoid co-cultures for patient 20–11. C) UMAPs are shown here to demonstrate concordance across all immune cell types between the parent tumor and organoid co-culture. All populations detected are shown on top with a color key on the right, and an overlay of these populations in the parent tumor (blue) and organoid co-cultures (orange) is shown below. D) Markers (Y axis) used to define each of the individual immune cell populations (X axis) in C are shown here along with the expression level in each defined cell type. The average expression level (colors) is shown in the percentage of cells (sphere) expressing each marker for each cell type. E) UMAPs are shown here to demonstrate concordance across all T cell types between the parent tumor and organoid co-culture. All populations detected are shown on top with a color key on the right, and an overlay of these populations in the parent tumor (blue) and organoid co-cultures (orange) is shown below. F) Markers (Y axis) used to define each of the different T cell populations (X axis) in E are shown here along with the expression level in each defined cell type. The average expression level (colors) is shown in the percentage of cells (sphere) expressing each marker for each cell type. CD8_Tnaive_memory= Naïve and memory CD8 T cells, CD4conv=Conventional non-regulatory CD4 T cells, Regulatory_T_cell=Regulatory CD4 T cells, T_Ki67=Proliferating T cells, CD8_Texh=Terminally exhausted CD8 T cells, CD8_Tpexh=Progenitor exhausted CD8 T cells